Every market has a seasonal pattern. The useful question is how often it held.
With twelve months and a few decades of history, something will always look striking. What separates a tendency worth a small nudge from a coincidence is the sample underneath it, so WatchTower draws the path, carries it forward from today, and shows whether it holds over 5, 10 and 15 years. It carries 13.5% of a currency composite, and no more than that on purpose.
Being straight about it
What a seasonal tendency is worth.
It is a prior, not a prediction. It shifts the odds a little before you look at anything else, and it is worth close to nothing against a live central bank repricing or a data surprise. A market that usually rises in October will fall in October the year the Fed turns, and the pattern will still be there in the average afterwards.
That is the whole reason it is weighted at 13.5% here rather than presented as a strategy. This section is before the panels rather than after them because a seasonality tool that puts its caveats at the bottom is selling the chart.
Three steps
The third is the one most tools skip.
The path
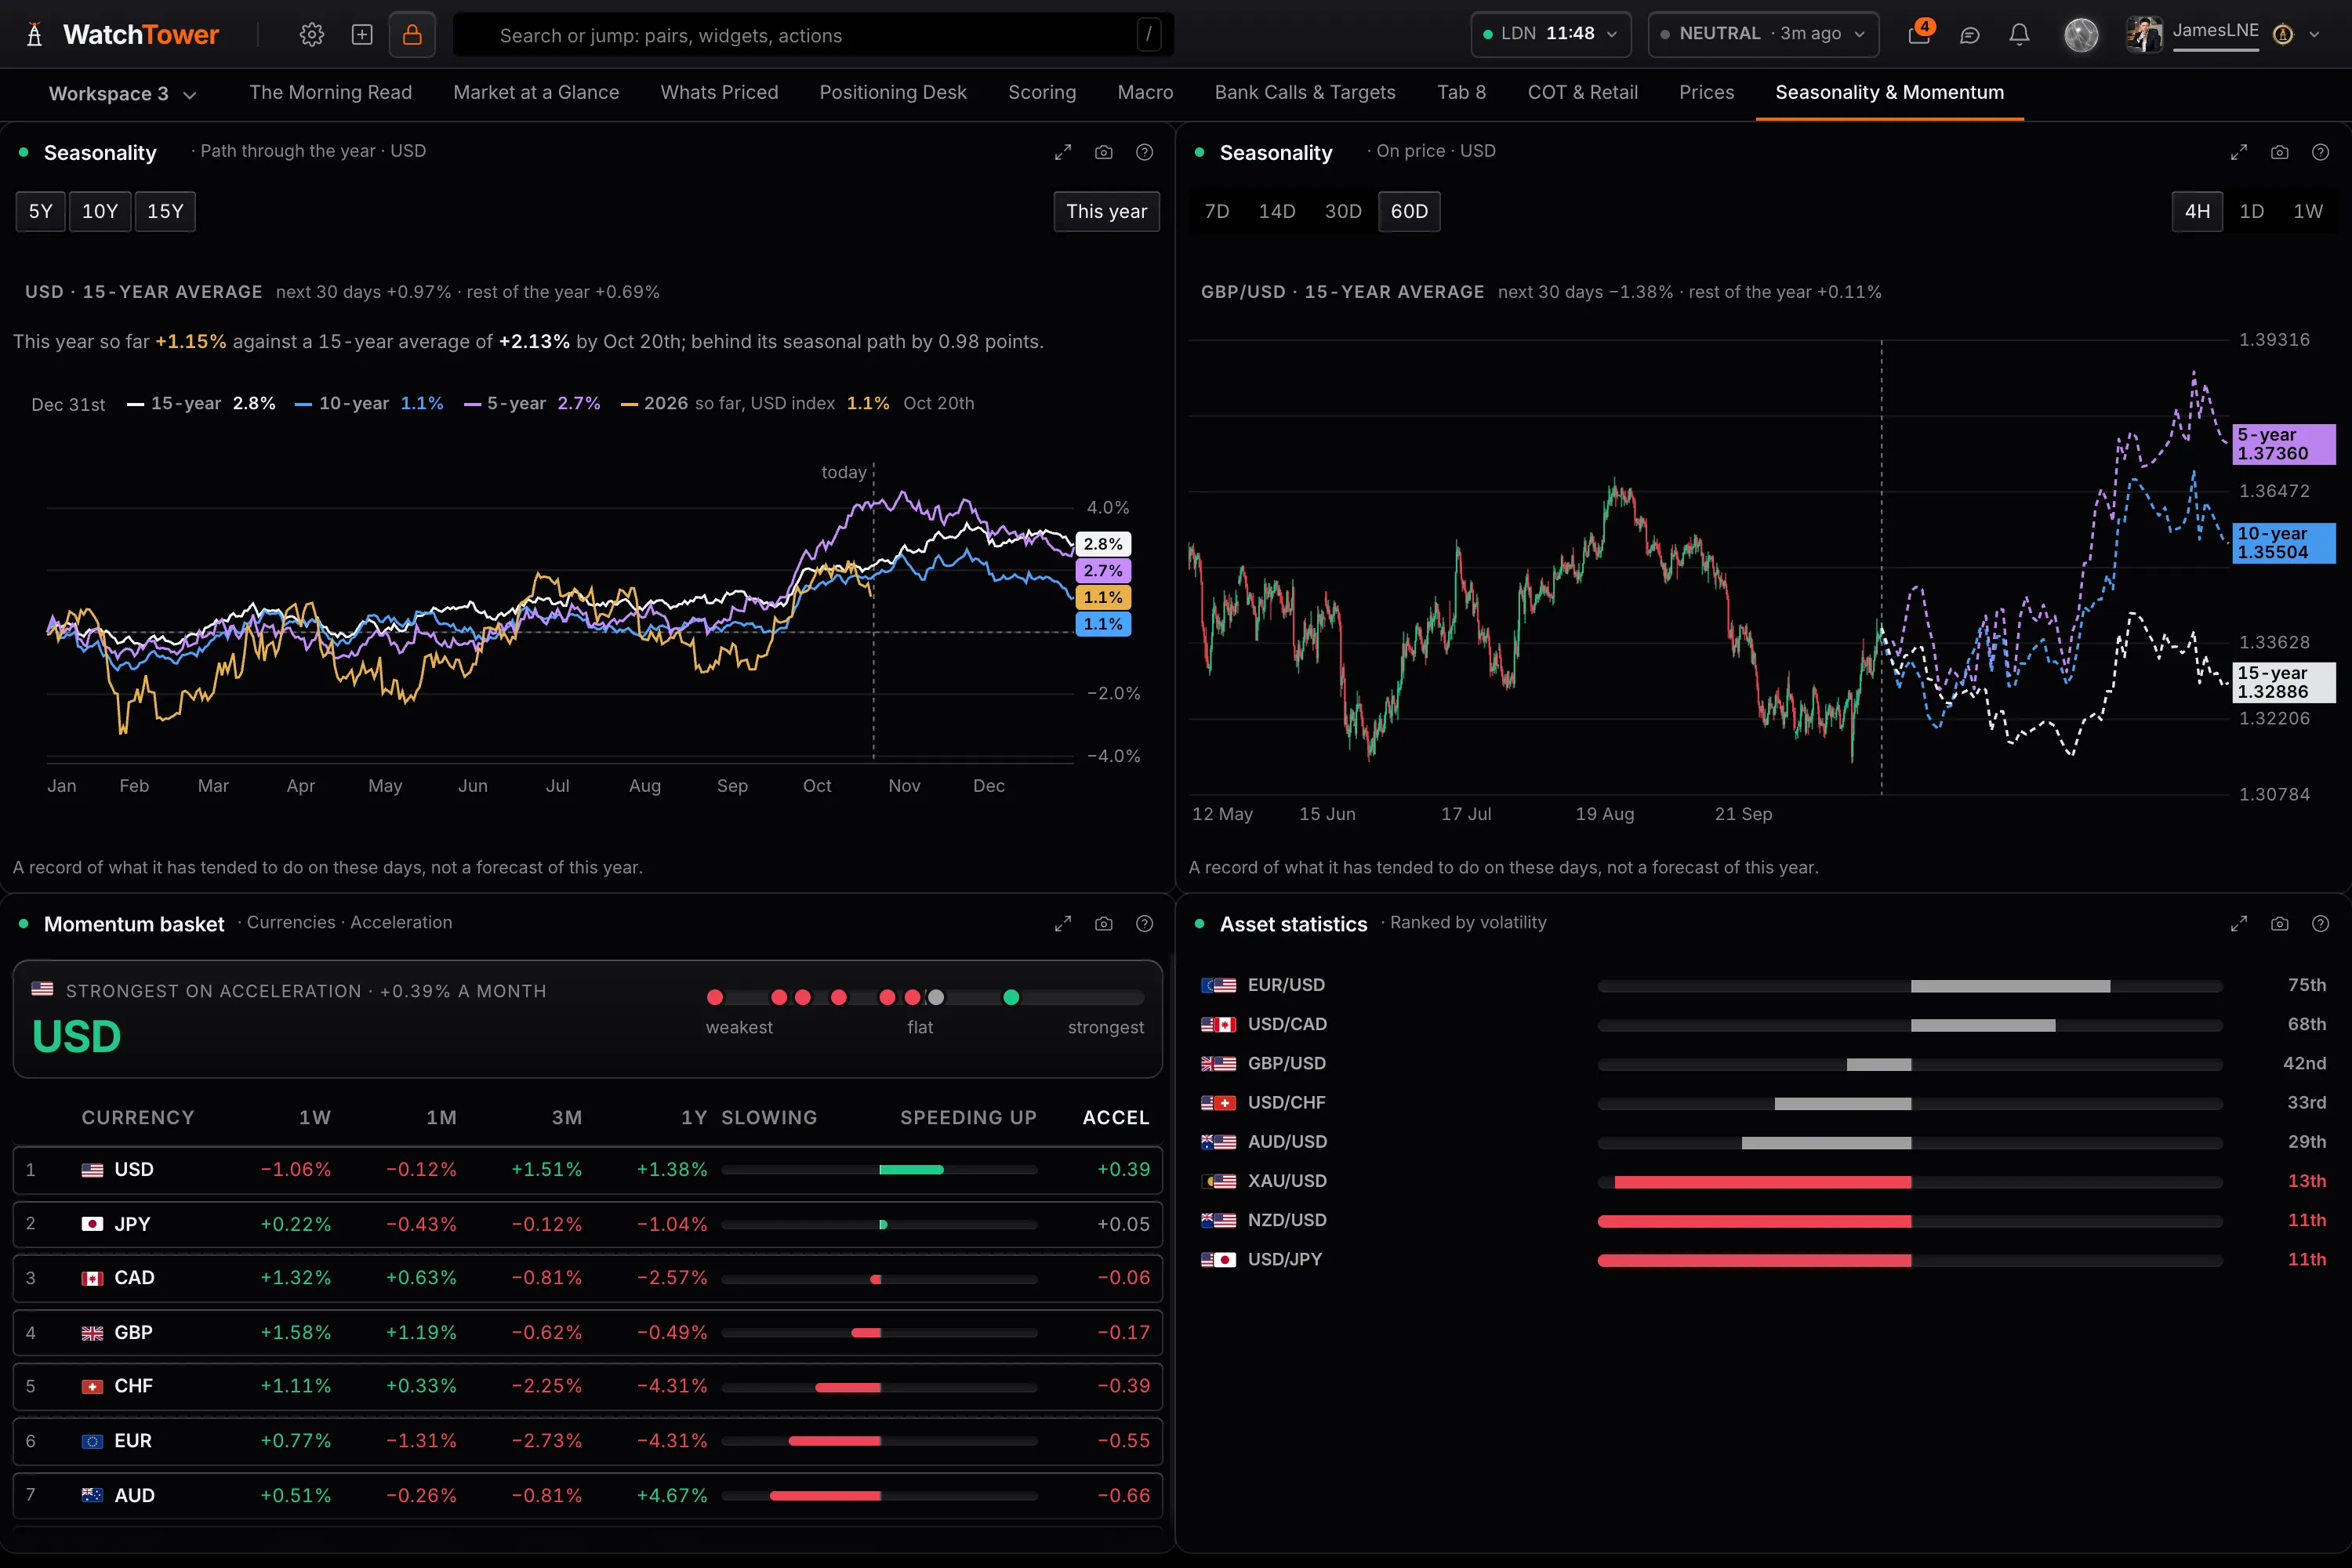
What a market has typically done through the year, averaged over past years and drawn as a percentage path with today marked, rather than left as a table of monthly averages. This year's own move can be drawn over it, day for day.
The projection
The path ahead from today over 7, 14, 30 or 60 days, and drawn on the asset's own candles, so the tendency is placed against where price actually is rather than left as a shape on its own.
The reliability
Whether the pattern holds when the look-back changes: the 5, 10 and 15 year paths drawn together, so a tendency that only exists in one window shows itself as a one-regime artefact. This is the step most seasonality tools skip, and it is the one that decides whether the first two mean anything.
Depth
An average, or an average with its sample attached.
The panels
Five panels, one free.
- Seasonality. Pro. What any market has tended to do on these calendar days in past years, five ways: the path through the year over 5, 10 and 15 years, the path ahead from today, that path on the asset's own candles, each month's average, and every asset over the weeks ahead. It records a tendency and makes no forecast.
- Asset statistics. Pro. The statistical profile behind the pattern: volatility term structure, return distribution and day-of-week or monthly bias, which is the context that says whether a seasonal move is large or ordinary for that market.
- Score history. Pro. The composite through time, so the seasonal component can be seen in the context of everything else that was scoring at once.
- Asset in full. Pro. One asset taken apart: every driver behind the score, including what seasonality contributes at its 13.5% weight, and how hard it pulls.
- Asset scores. Free. Every monitored asset with its composite score and the drivers behind it, seasonality among them. Open a row for what each driver is contributing and the weight it carries.
Seasonality, answered.
What is FX seasonality?
The tendency of a market to move in a particular direction at a particular time of year, measured across its recorded history. It comes from real things, fiscal year ends, commodity cycles, repatriation flows and holiday liquidity, but the effect is a tendency across many years rather than a rule about any one of them.
Does seasonality actually work?
Sometimes, weakly, and not reliably enough to trade on its own. The honest description is that it is a prior: it shifts the odds slightly before you look at anything else, and it is worth almost nothing against a live central bank repricing or a data surprise. That is why it sits at 13.5% of the composite here rather than at the front of it.
How do you know a pattern is not just noise?
You often cannot be certain, and the panel shows you what it has rather than deciding for you: the same path over 5, 10 and 15 years, drawn together. A tendency that shows in every window is a different object from one that only appears over a single stretch of years, and they look identical if all you print is one average.
How far back does the history go?
Up to 15 years, read as 5, 10 and 15 year windows, so you can see whether a pattern is recent or long-standing rather than taking one average on trust.
Which markets have seasonal data?
All 24 scored markets: currencies, metals and energy, and equity indices.
Is it free?
Seasonality is a Pro panel, as are Asset statistics, Score history and Asset in full, at $49 a month or $490 a year. On the free plan, seasonality still reaches you as one of the drivers in Asset scores, where you can open a row and see what it contributes. The free plan carries 15 of the 49 panels across 2 boards, and every new account opens with 14 days of Pro, no card.