Free data, no account
Central bank rate probability
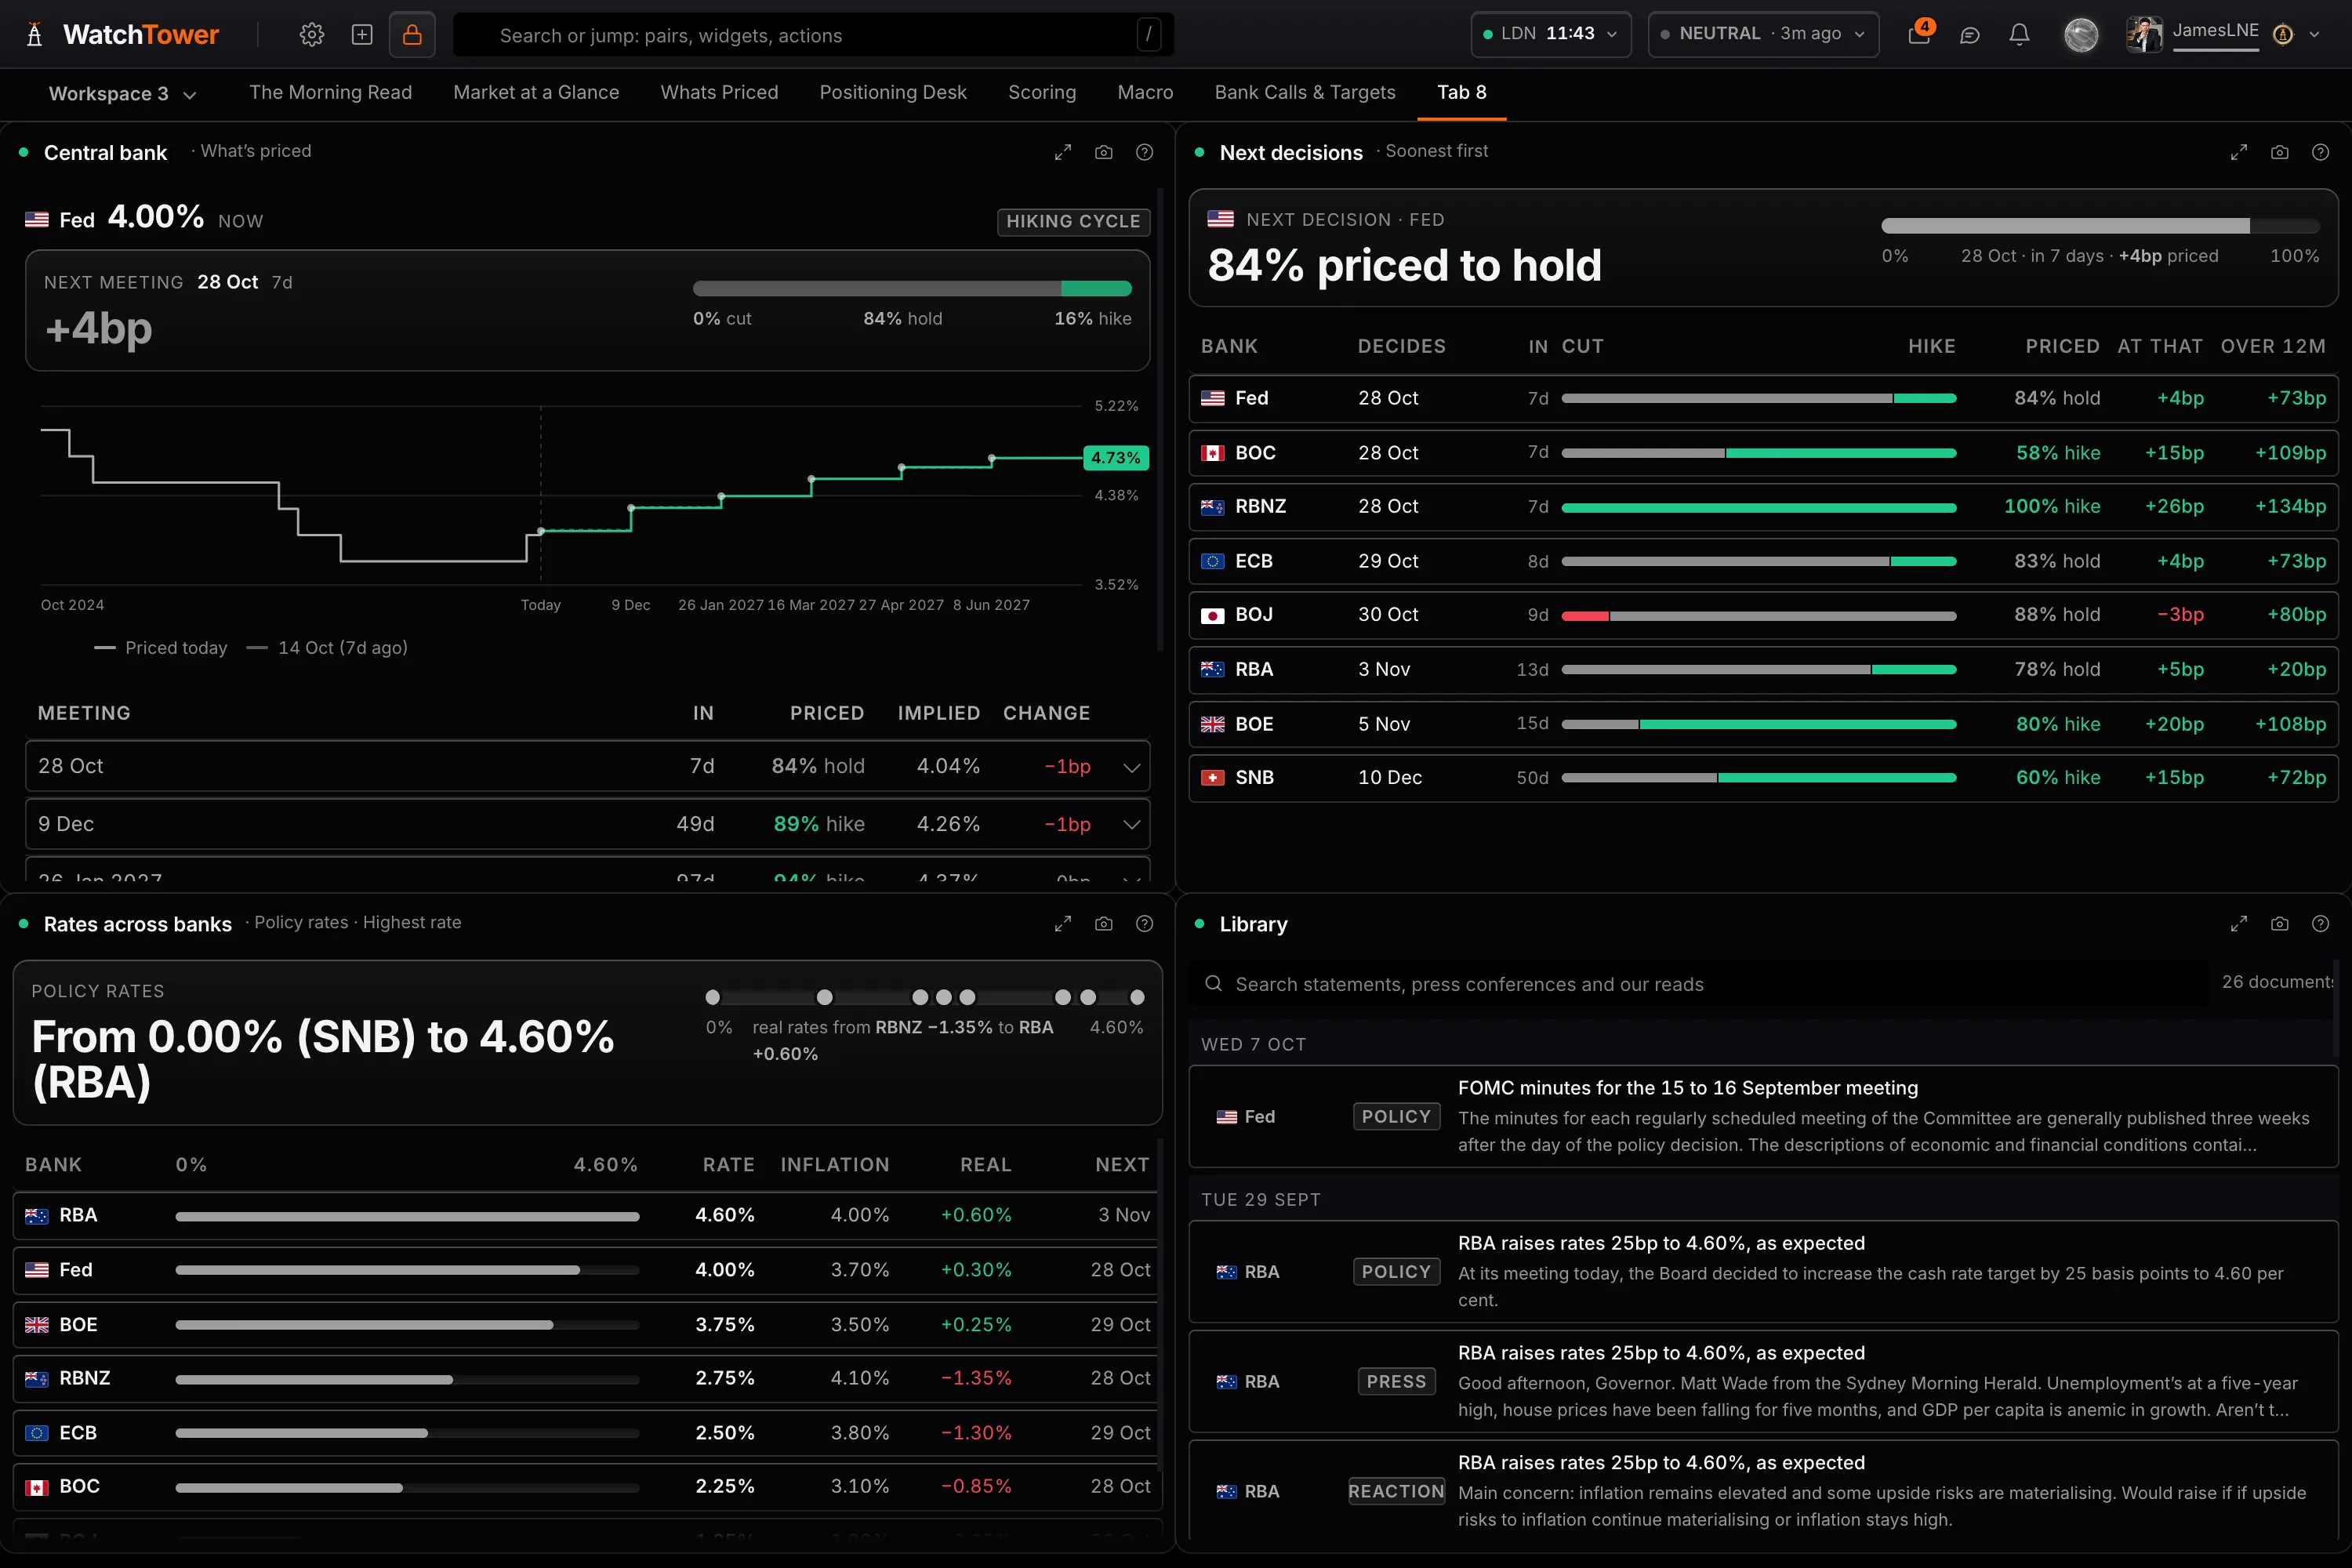
What the market has priced for the next decision at 8 central banks, meeting by meeting for the next twelve months, and the instrument behind every curve.
Reading of 28 Oct, 14:54 London
Next decisions
Soonest first. Select a bank for every meeting it has priced.
One bank, meeting by meeting
What is priced at the next decision, and the split at every meeting for the next twelve months.
Federal Reserve
Exchange-traded futures
The meeting-by-meeting path for the Federal Reserve is in the Central bank panel in the terminal, free on every account. The next-meeting call above is derived from Exchange-traded futures.
European Central Bank
Exchange-traded futures, WatchTower model
| Meeting | Implied rate | vs now | Cut | Hold | Hike | Priced |
|---|---|---|---|---|---|---|
| 29 Oct 26 | 2.53% | +3bp | · | 88.4% | 11.6% | Hold 88.4% |
| 17 Dec 26 | 2.68% | +18bp | · | 39.6% | 60.4% | Hike 60.4% |
| 4 Feb 27 | 2.82% | +32bp | · | 44.4% | 55.6% | Hike 55.6% |
| 18 Mar 27 | 2.92% | +42bp | · | 61.6% | 38.4% | Hold 61.6% |
| 29 Apr 27 | 3.02% | +52bp | · | 58.8% | 41.2% | Hold 58.8% |
| 10 Jun 27 | 3.11% | +61bp | · | 62.0% | 38.0% | Hold 62.0% |
| 22 Jul 27 | 3.17% | +67bp | · | 76.4% | 23.6% | Hold 76.4% |
| 9 Sept 27 | 3.22% | +72bp | · | 80.0% | 20.0% | Hold 80.0% |
| 28 Oct 27 | 3.25% | +75bp | · | 89.2% | 10.8% | Hold 89.2% |
Implied rate is where the market prices the policy rate after each meeting, for the next twelve months. The split is for that meeting alone, from the step priced since the meeting before, in 25bp moves. Derived from Exchange-traded futures, WatchTower model.
Bank of Japan
Exchange-traded futures, WatchTower model
| Meeting | Implied rate | vs now | Cut | Hold | Hike | Priced |
|---|---|---|---|---|---|---|
| 30 Oct 26 | 1.22% | -3bp | 14.0% | 86.0% | · | Hold 86.0% |
| 18 Dec 26 | 1.40% | +15bp | · | 27.2% | 72.8% | Hike 72.8% |
| 22 Jan 27 | 1.54% | +29bp | · | 40.8% | 59.2% | Hike 59.2% |
| 18 Mar 27 | 1.64% | +39bp | · | 62.0% | 38.0% | Hold 62.0% |
| 28 Apr 27 | 1.74% | +49bp | · | 61.2% | 38.8% | Hold 61.2% |
| 11 Jun 27 | 1.83% | +59bp | · | 60.8% | 39.2% | Hold 60.8% |
| 22 Jul 27 | 1.92% | +67bp | · | 67.2% | 32.8% | Hold 67.2% |
| 22 Sept 27 | 1.98% | +73bp | · | 76.8% | 23.2% | Hold 76.8% |
| 29 Oct 27 | 2.03% | +78bp | · | 77.6% | 22.4% | Hold 77.6% |
Implied rate is where the market prices the policy rate after each meeting, for the next twelve months. The split is for that meeting alone, from the step priced since the meeting before, in 25bp moves. Derived from Exchange-traded futures, WatchTower model.
Reserve Bank of Australia
Exchange-traded futures, WatchTower model
| Meeting | Implied rate | vs now | Cut | Hold | Hike | Priced |
|---|---|---|---|---|---|---|
| 3 Nov 26 | 4.74% | +14bp | · | 44.0% | 56.0% | Hike 56.0% |
| 8 Dec 26 | 4.80% | +20bp | · | 77.6% | 22.4% | Hold 77.6% |
| 2 Feb 27 | 4.84% | +24bp | · | 81.6% | 18.4% | Hold 81.6% |
| 16 Mar 27 | 4.88% | +28bp | · | 83.2% | 16.8% | Hold 83.2% |
| 4 May 27 | 4.88% | +28bp | · | 100% | · | Hold 100% |
| 15 Jun 27 | 4.88% | +28bp | · | 100% | · | Hold 100% |
Implied rate is where the market prices the policy rate after each meeting, for the next twelve months. The split is for that meeting alone, from the step priced since the meeting before, in 25bp moves. Derived from Exchange-traded futures, WatchTower model.
Bank of England
Exchange-traded futures, WatchTower model
| Meeting | Implied rate | vs now | Cut | Hold | Hike | Priced |
|---|---|---|---|---|---|---|
| 5 Nov 26 | 3.95% | +20bp | · | 20.0% | 80.0% | Hike 80.0% |
| 17 Dec 26 | 4.11% | +36bp | · | 35.2% | 64.8% | Hike 64.8% |
| 4 Feb 27 | 4.29% | +54bp | · | 30.8% | 69.2% | Hike 69.2% |
| 18 Mar 27 | 4.47% | +72bp | · | 27.2% | 72.8% | Hike 72.8% |
| 29 Apr 27 | 4.62% | +87bp | · | 40.8% | 59.2% | Hike 59.2% |
| 17 Jun 27 | 4.72% | +97bp | · | 56.4% | 43.6% | Hold 56.4% |
| 29 Jul 27 | 4.80% | +105bp | · | 67.6% | 32.4% | Hold 67.6% |
| 16 Sept 27 | 4.86% | +111bp | · | 80.0% | 20.0% | Hold 80.0% |
Implied rate is where the market prices the policy rate after each meeting, for the next twelve months. The split is for that meeting alone, from the step priced since the meeting before, in 25bp moves. Derived from Exchange-traded futures, WatchTower model.
Bank of Canada
Exchange-traded futures, WatchTower model
| Meeting | Implied rate | vs now | Cut | Hold | Hike | Priced |
|---|---|---|---|---|---|---|
| 9 Dec 26 | 2.42% | -8bp | 32.8% | 67.2% | · | Hold 67.2% |
| 27 Jan 27 | 2.81% | +31bp | · | · | 100% | Hike 100% |
| 3 Mar 27 | 2.90% | +40bp | · | 67.6% | 32.4% | Hold 67.6% |
| 28 Apr 27 | 2.94% | +44bp | · | 82.0% | 18.0% | Hold 82.0% |
| 2 Jun 27 | 3.06% | +56bp | · | 52.4% | 47.6% | Hold 52.4% |
| 21 Jul 27 | 3.18% | +68bp | · | 50.4% | 49.6% | Hold 50.4% |
| 8 Sept 27 | 3.27% | +77bp | · | 64.4% | 35.6% | Hold 64.4% |
| 27 Oct 27 | 3.32% | +82bp | · | 82.4% | 17.6% | Hold 82.4% |
Implied rate is where the market prices the policy rate after each meeting, for the next twelve months. The split is for that meeting alone, from the step priced since the meeting before, in 25bp moves. Derived from Exchange-traded futures, WatchTower model.
Reserve Bank of New Zealand
Exchange-traded futures, WatchTower model
| Meeting | Implied rate | vs now | Cut | Hold | Hike | Priced |
|---|---|---|---|---|---|---|
| 9 Dec 26 | 3.28% | +53bp | · | · | 100% | Hike 100% |
| 10 Feb 27 | 3.52% | +77bp | · | 2.8% | 97.2% | Hike 97.2% |
| 17 Mar 27 | 3.63% | +88bp | · | 58.8% | 41.2% | Hold 58.8% |
| 5 May 27 | 3.75% | +100bp | · | 49.6% | 50.4% | Hike 50.4% |
| 16 Jun 27 | 3.90% | +115bp | · | 42.4% | 57.6% | Hike 57.6% |
| 4 Aug 27 | 3.99% | +124bp | · | 62.4% | 37.6% | Hold 62.4% |
| 15 Sept 27 | 4.04% | +129bp | · | 80.0% | 20.0% | Hold 80.0% |
| 27 Oct 27 | 4.09% | +134bp | · | 80.8% | 19.2% | Hold 80.8% |
Implied rate is where the market prices the policy rate after each meeting, for the next twelve months. The split is for that meeting alone, from the step priced since the meeting before, in 25bp moves. Derived from Exchange-traded futures, WatchTower model.
Swiss National Bank
Exchange-traded futures, WatchTower model
| Meeting | Implied rate | vs now | Cut | Hold | Hike | Priced |
|---|---|---|---|---|---|---|
| 10 Dec 26 | 0.11% | +11bp | · | 55.6% | 44.4% | Hold 55.6% |
| 18 Mar 27 | 0.27% | +27bp | · | 36.0% | 64.0% | Hike 64.0% |
| 17 Jun 27 | 0.41% | +41bp | · | 42.8% | 57.2% | Hike 57.2% |
| 23 Sept 27 | 0.52% | +52bp | · | 58.8% | 41.2% | Hold 58.8% |
Implied rate is where the market prices the policy rate after each meeting, for the next twelve months. The split is for that meeting alone, from the step priced since the meeting before, in 25bp moves. Derived from Exchange-traded futures, WatchTower model.
Every bank's priced path, on one axis
Switch to Relative to read banks at very different rates on one scale: basis points priced from today.
Not drawn: Fed, whose meeting-by-meeting path is not published here. A flat line would read as the market expecting nothing, which is not the same as having nothing to show.
The eight banks
Every curve, and the instrument it is built from.
A probability means nothing until you know what produced it. This is the whole table.
In the terminal
The same curves, with the history behind them.
Central bank and Next decisions are free panels: the path set against a day, a week or a month ago, the latest decision and statement, and the banks ranked hawkish to dovish. Every new account opens with 14 days of Pro, no card.
Depth
A level, or the whole derivation.
Being straight about it
Where this model is running on an assumption.
Seven of the eight curves are built from futures on the policy rate itself, so there is nothing between the instrument and the rate. New Zealand is different: the liquid contract is on 90-day bank bills, which carry a bank credit spread over the official cash rate. That spread has to be measured and removed before any probability is calculated.
When it cannot be measured, the model uses an assumed figure, and the panel says so: the bank is marked indicative and the assumed figure is in the tooltip. On a 25bp step, a 5bp error in that spread is worth about 20 points of implied probability, which is why it is published rather than buried. A member found this by comparing the terminal's reading against his own sources, and the fix and the marking both came from that exchange.
The panels
Four panels.
- Next decisions. Free. Every bank's next decision with the odds of a cut, a hold and a hike, the decisions landing over the next six weeks, and the banks ranked hawkish to dovish on twelve months priced, the next meeting or the real policy rate. Banks with no traded instrument behind them are marked as an estimate.
- Central bank. Free. One bank in full: what the market prices for it meeting by meeting, set against the path a day, a week or a month ago with each meeting's change in basis points; its latest decision with the statement and what changed; its rate, inflation, real rate and stance; and how it compares with its peers.
- Rates across banks. Pro. Every bank side by side: policy rates and real rates, how far the market has repriced each path over a week, a month or a quarter, every bank's pricing through the day with the releases that moved it, and the carry in every pair on nominal, real or forward rates.
- Rate spread. Pro. Two banks' priced rates as one spread against the pair, at the policy rate and 3, 6 and 12 months out, or the 2-year and 10-year bond yield spreads. It also shows the gap across horizons against a week ago, and how much of the pair's recent move the spreads explain.
Rate probability, answered.
How is the probability of a rate cut or hike calculated?
From the step the market prices between one meeting and the next, divided by the size of a policy step. The terminal shows both the marginal probability for a single meeting and the cumulative probability across the path. It is not derived by comparing a forward level against today's policy rate, which is a common shortcut that produces figures the arithmetic does not support.
What instrument is each curve built from?
Exchange-traded futures on the relevant overnight or short-term rate, per bank, listed in the table on this page. The instrument matters: a curve built from bank bills carries a credit spread over the policy rate and has to be adjusted into policy space before any of it means anything.
Is the number the most likely outcome or the market level?
The market-implied level from a fitted curve. It is not rounded into policy steps and it is not the modal outcome, so a reading of 2.875% means the curve sits there rather than meaning a 3.00% outcome is expected.
How sensitive is the probability to a small change in the rate?
Very. On a 25bp policy step, a 5bp difference in the implied level is worth roughly 20 percentage points of implied probability. That is why the instrument and any adjustment applied to it are published here rather than hidden, and why a reading that does not survive a realistic wobble in that adjustment is marked as fragile.
How often does it update?
The model re-runs on a schedule and also when a policy rate actually changes, so the anchor cannot sit at a stale rate after a decision.
Is any of this free?
Yes. Central bank and Next decisions are among the 15 free panels, so what is priced for each of the 8 banks, meeting by meeting, is on the free plan. Rates across banks and Rate spread are Pro, at $49 a month, and every new account opens with 14 days of Pro with no card, after which it stays free.