Features
49 panels. 133 reads. All of them named below.
Most tools describe their features. This page names every panel in the terminal, says what one row of it holds and lists the reads inside it, because a list you can check is worth more than a page of adjectives.
- 49
- Panels in the library
- 14
- Categories
- 15
- Free, no card
- 24
- Markets scored
- 28
- Templates to start from
The tracked universe
Named in full, so you can check it against what you trade.
9
Currencies
USD, EUR, GBP, JPY, CHF, AUD, CAD, NZD, MXN
6
Metals and energy
Gold, silver, platinum, palladium, copper, WTI
9
Equity indices
S&P 500, Nasdaq 100, Dow, DAX, FTSE 100, CAC 40, Euro Stoxx 50, IBEX 35, Nikkei 225
8
Central banks
Fed, ECB, BoE, BoJ, SNB, RBA, BoC, RBNZ
Scores and bias
One number per market, and the whole derivation.
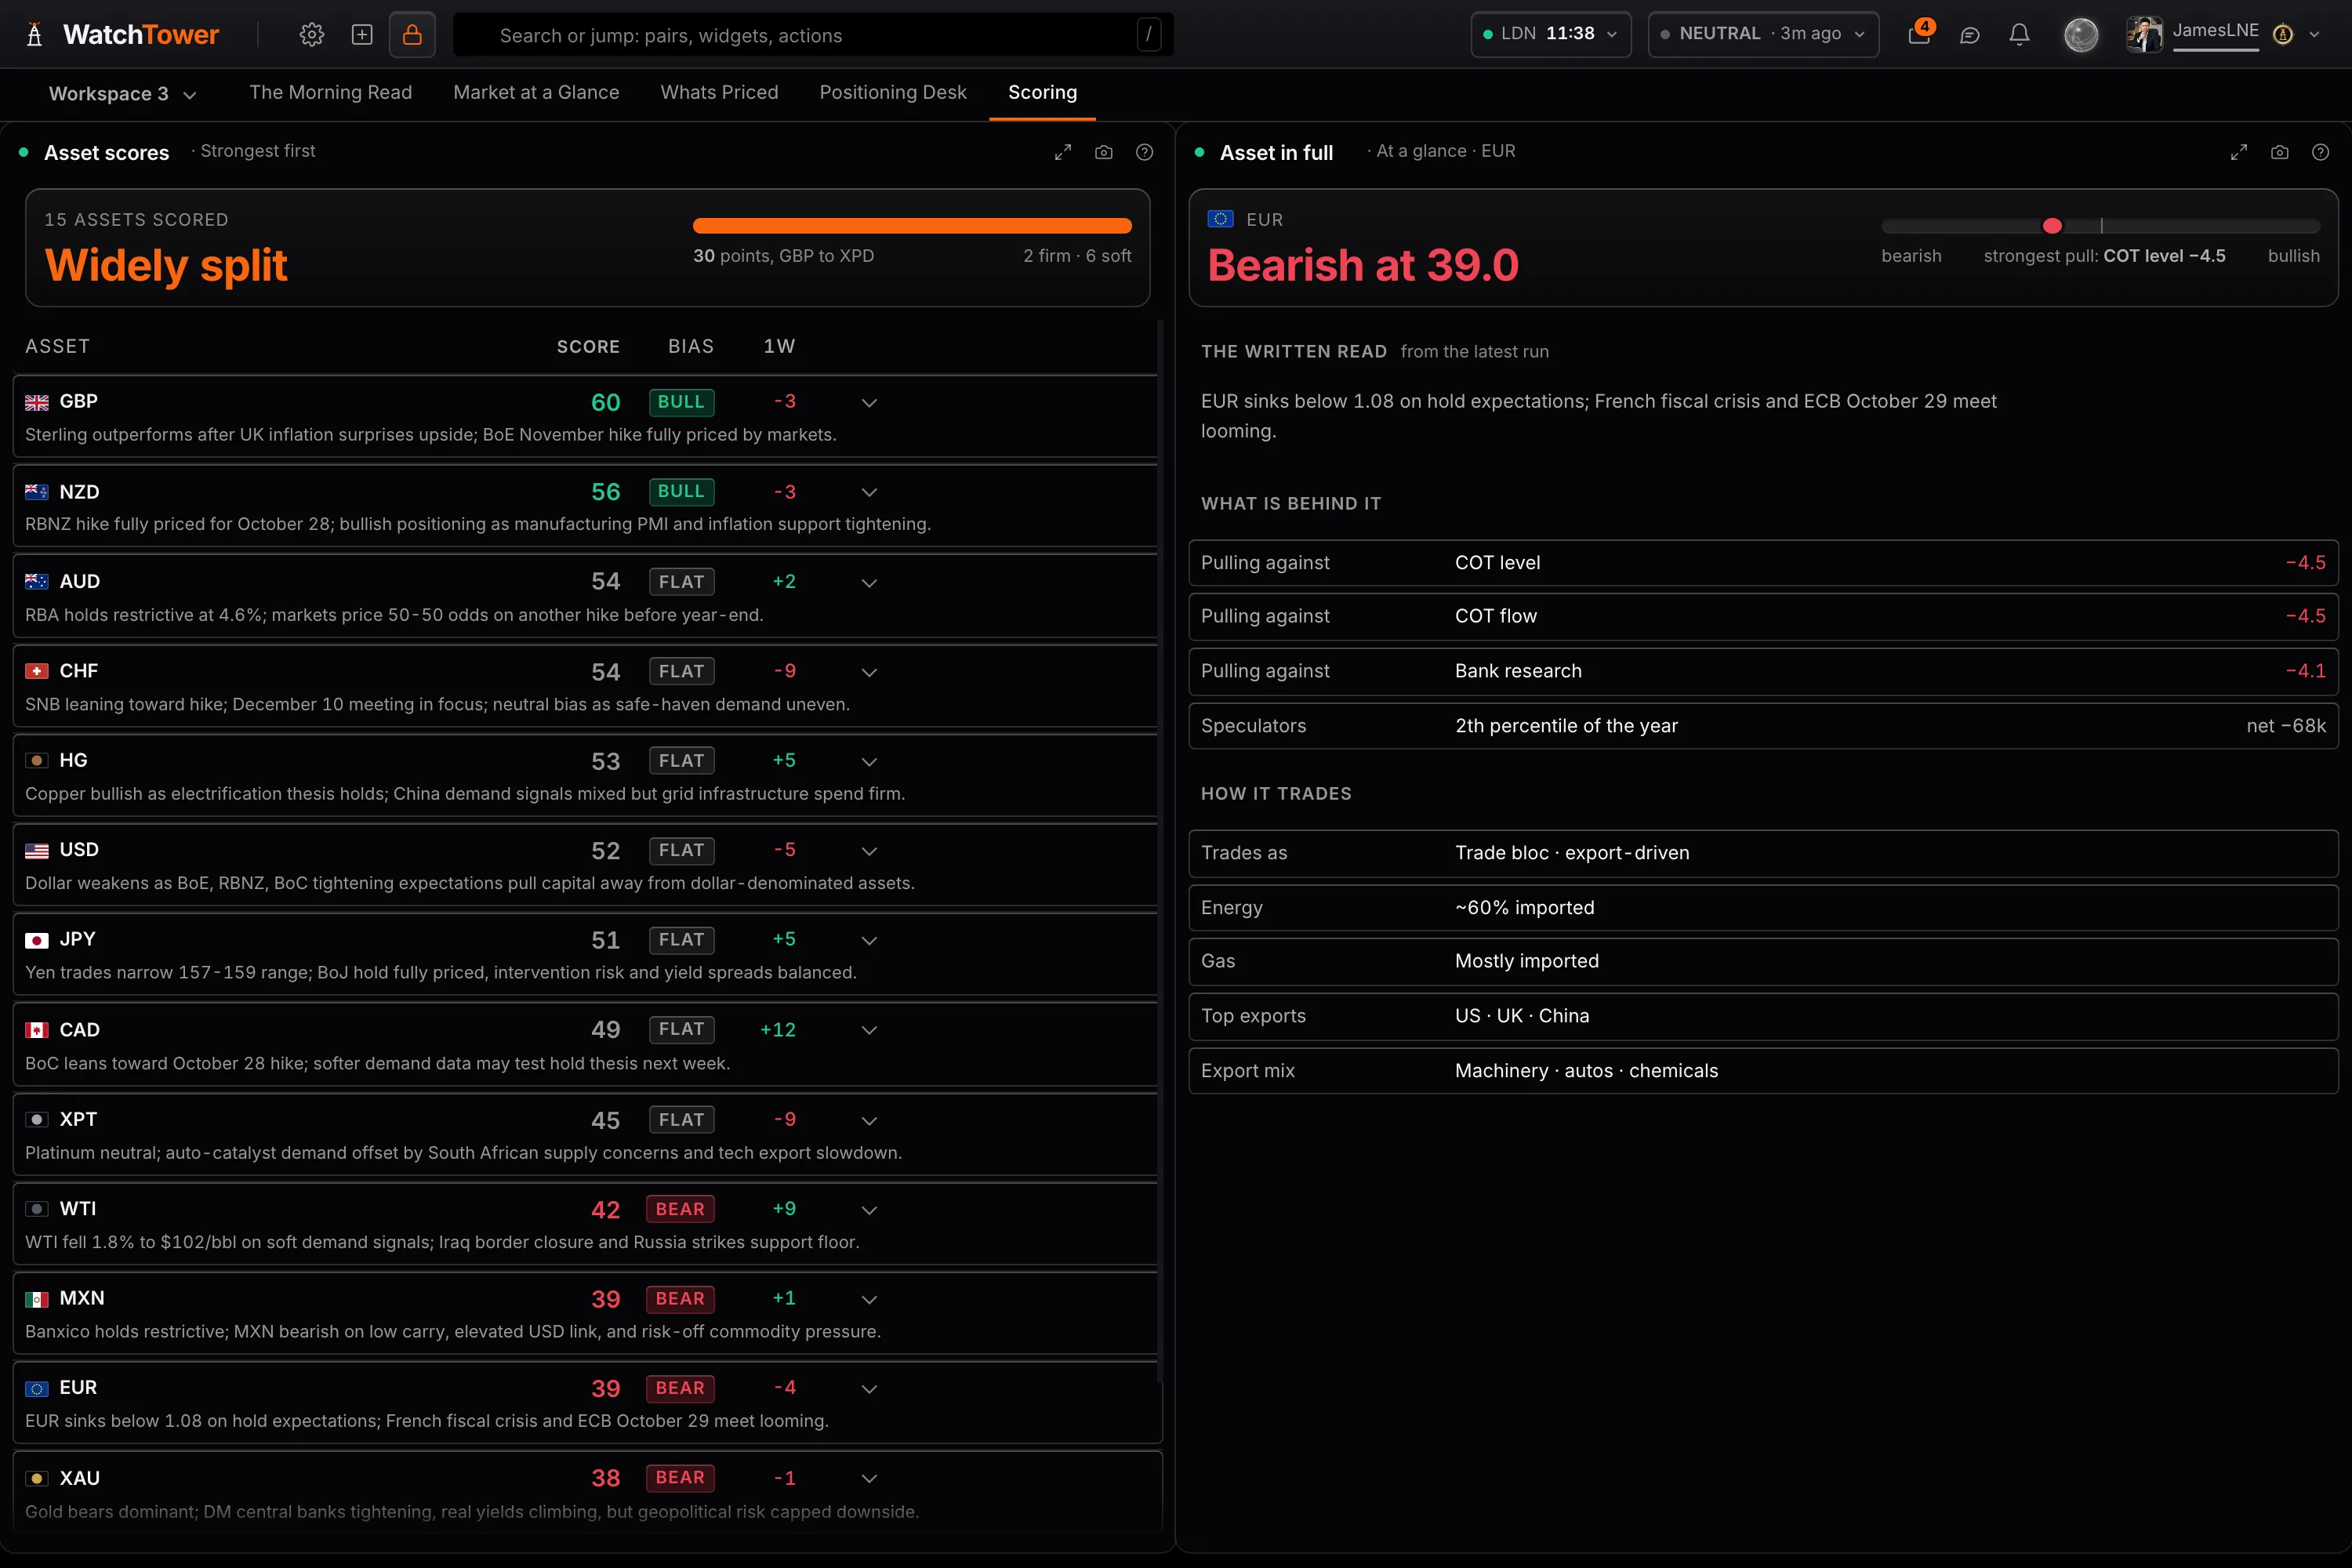
Every market carries a composite score from 0 to 100 on published weights. 56 and above reads bullish, below 45 reads bearish, and the band between the two is neutral. The scale reads the same way on all 24 assets, and Asset scores, with every driver behind each one, is free.
Score history shows how the scores have moved, what crossed neutral, where score and price disagree, and one market's bullish and bearish runs drawn on its own chart. Asset in full and Pair in full open one market completely, and the Trade scanner ranks every cross, metal and index by how many of its drivers agree.
Bank research
48 institutions, read and made comparable.
Every report lands in the Research inbox and stays readable in the panel, so nothing is summarised away. Open one and break it down into its argument, the subjects it covers and its calls.
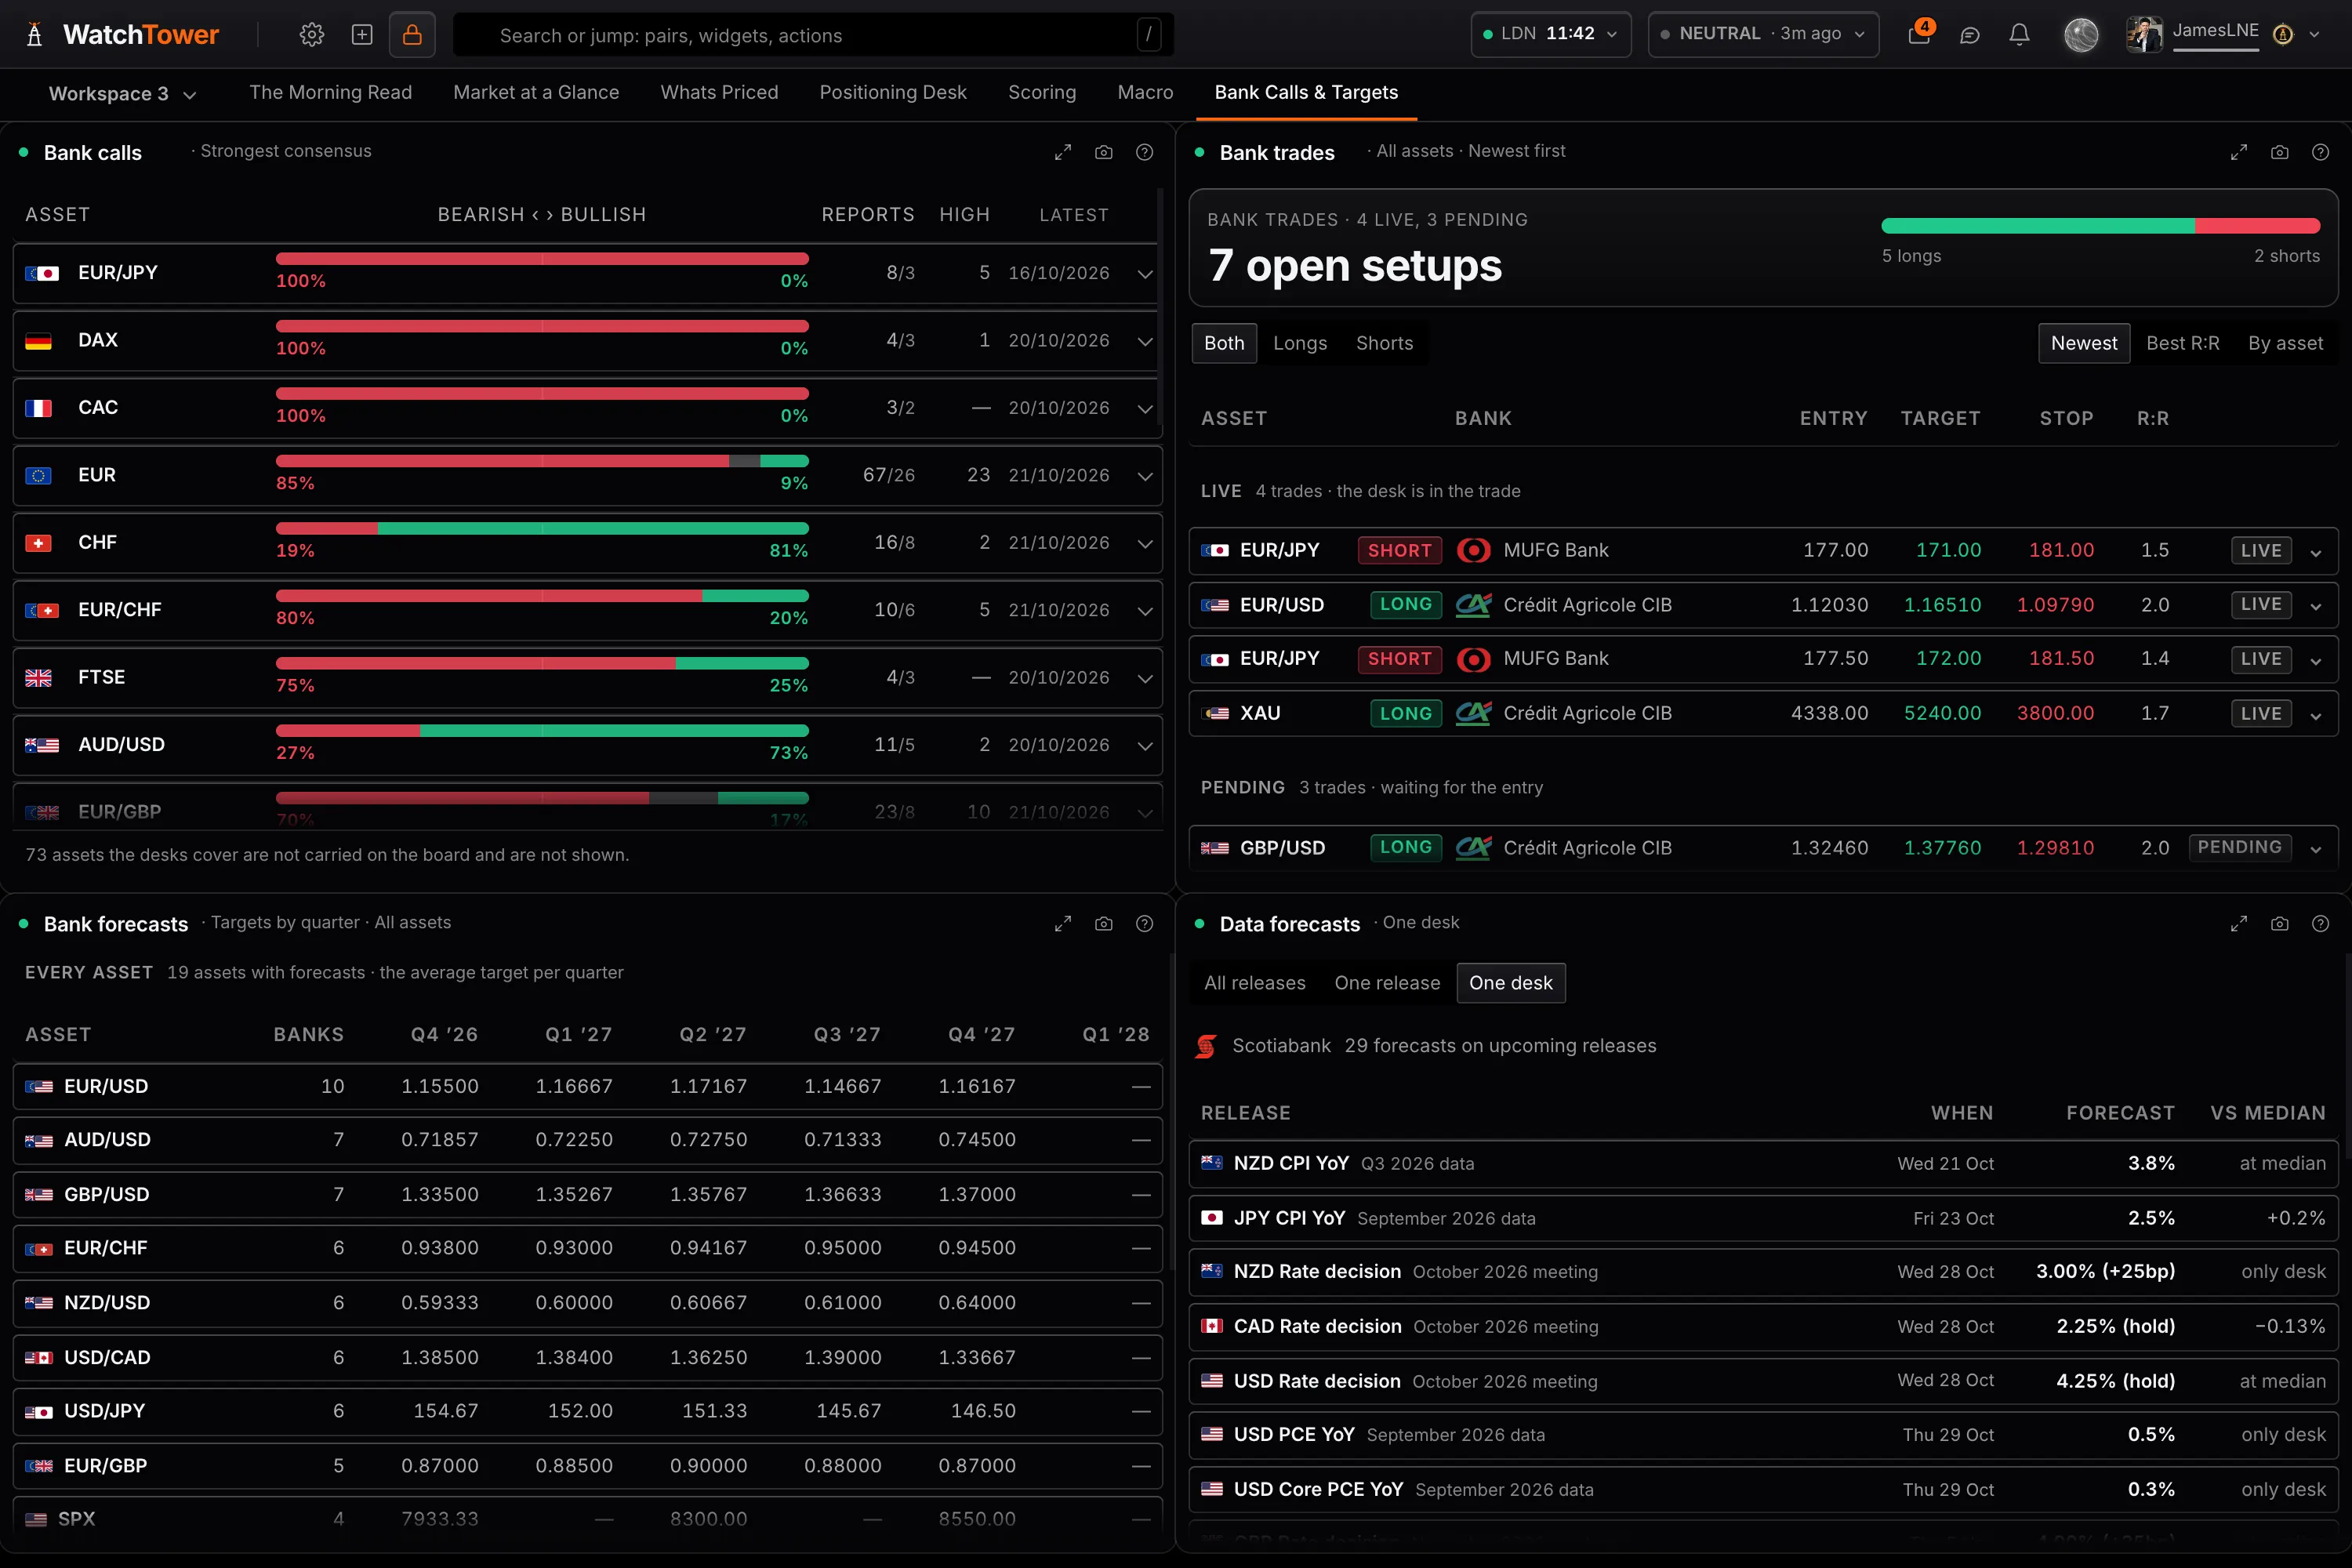
That is what makes the desks comparable. Bank calls shows how the reports split and how many desks are behind each side, Bank trades lists every published setup with its entry, target and stop, Bank forecasts draws each bank's targets forward, and Data forecasts shows who is behind the consensus for an upcoming release and how far apart they are.
Central banks and rates
What the market prices, and how far it has moved.
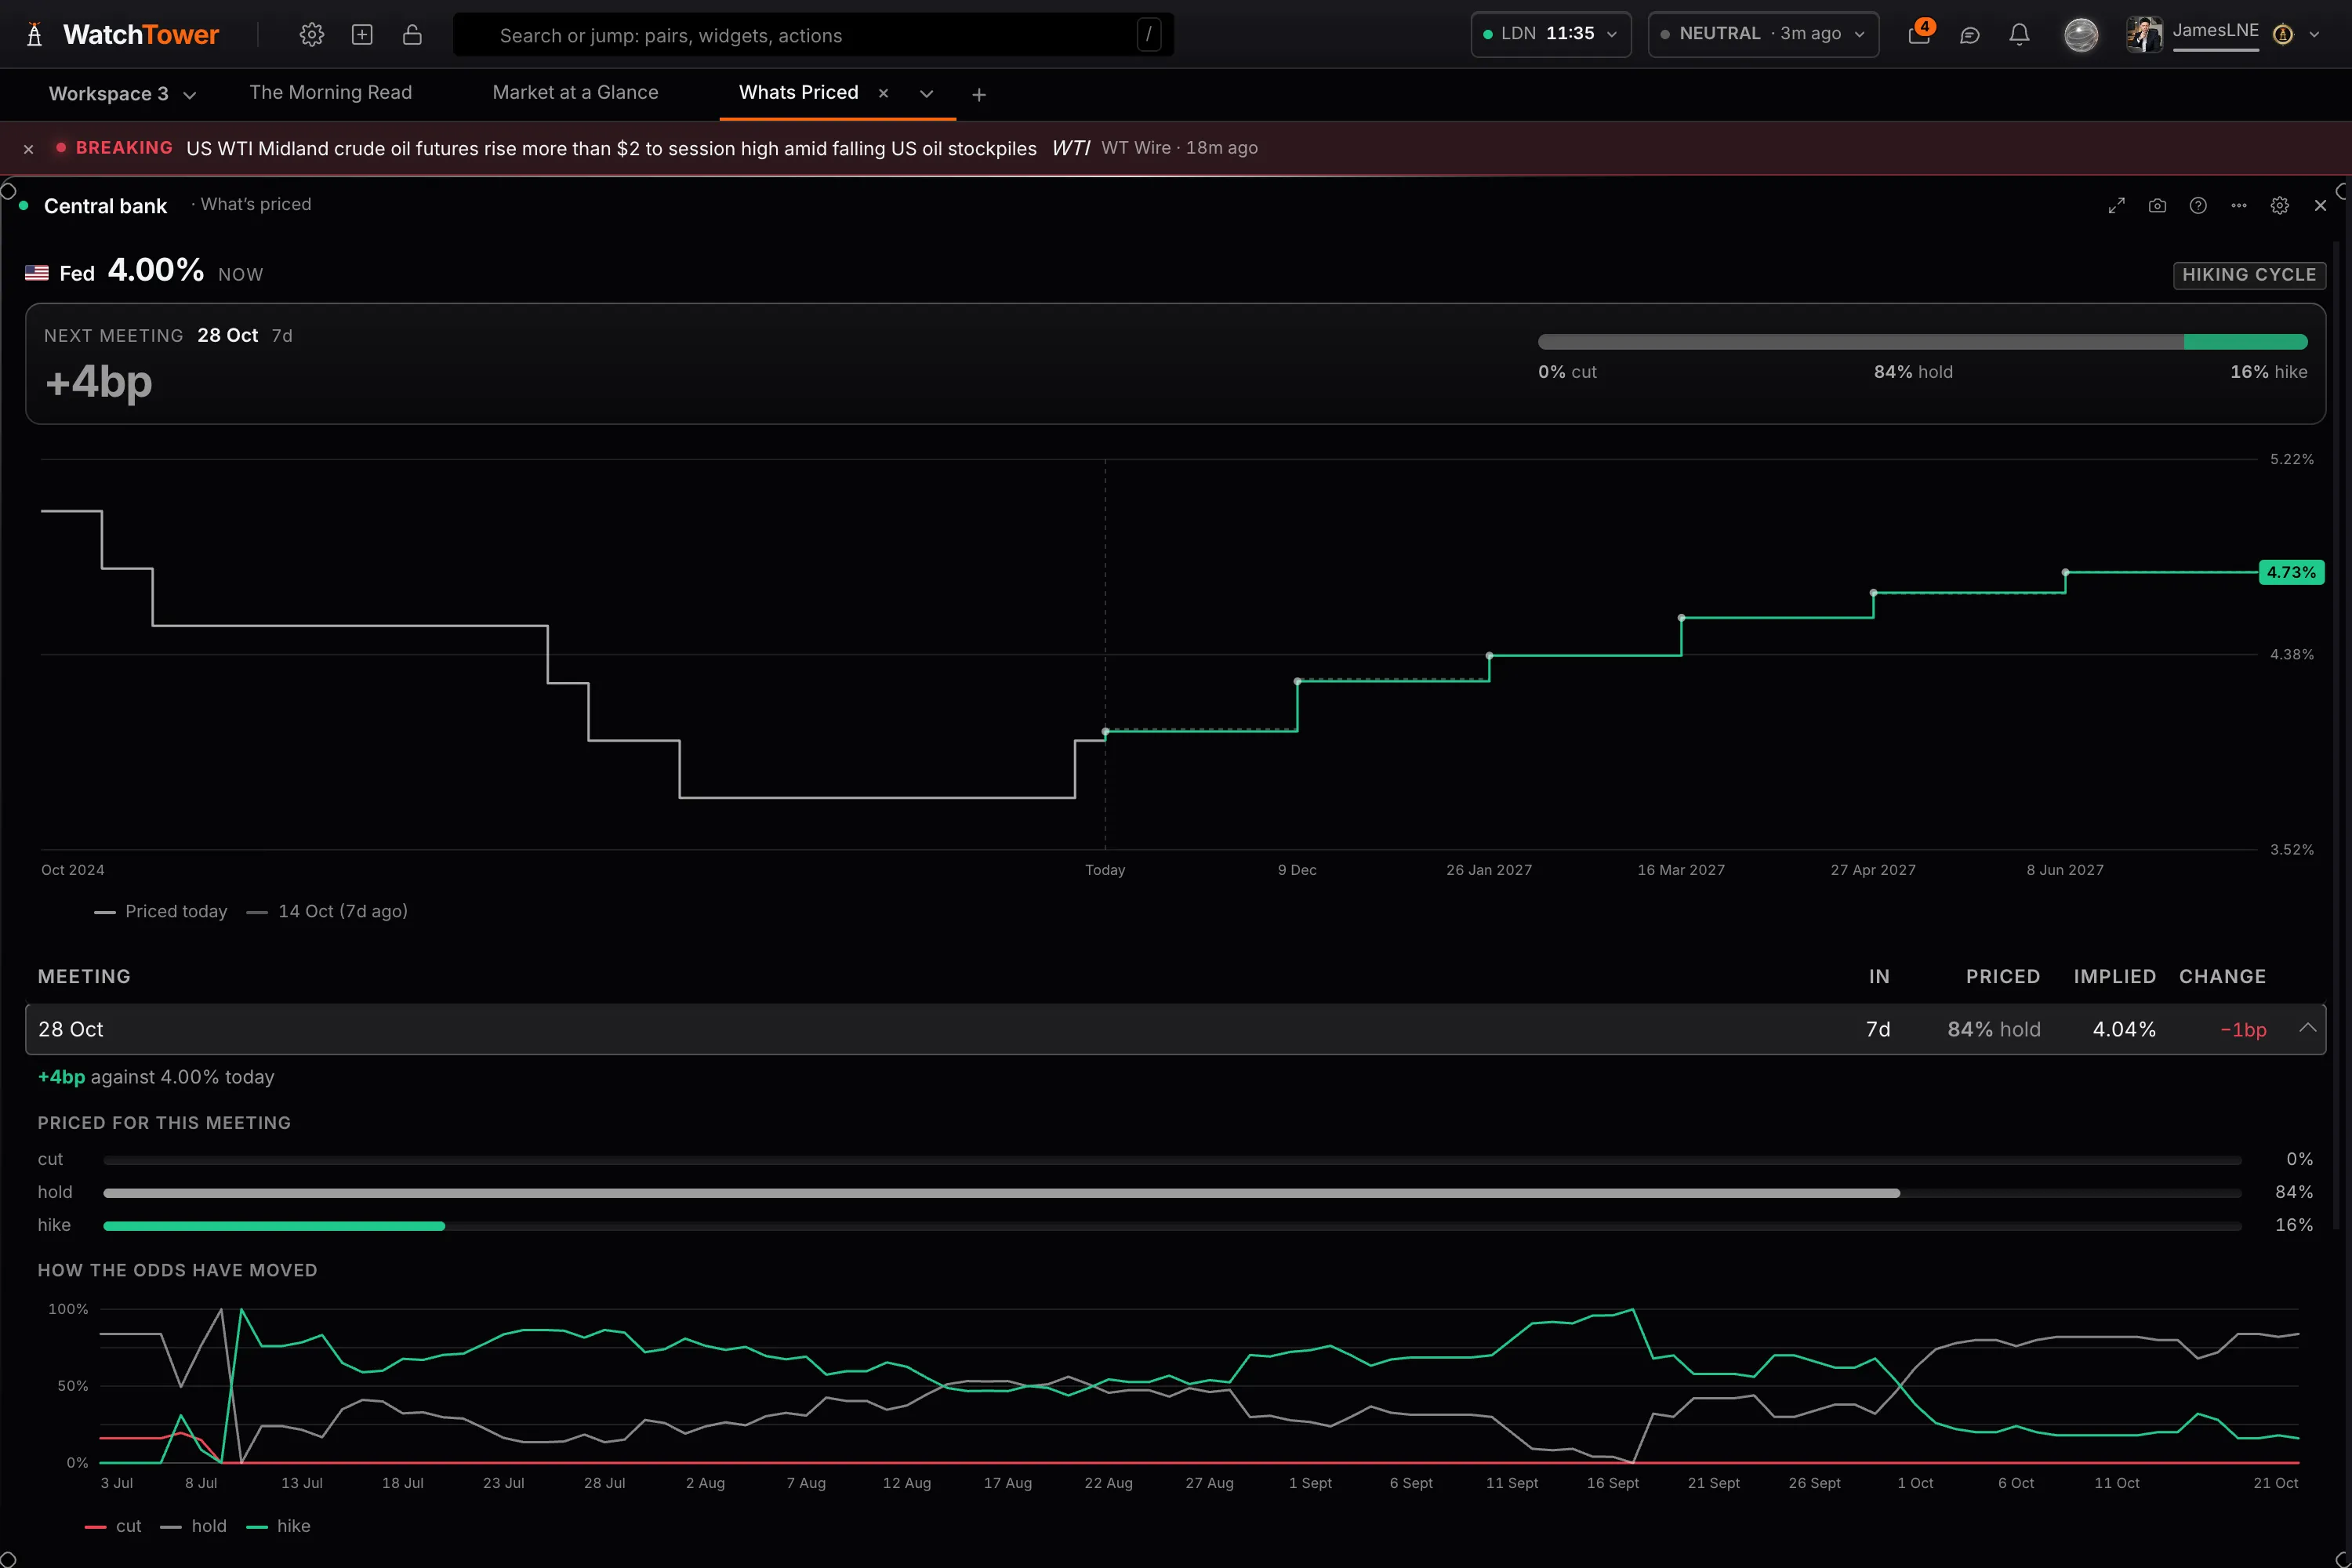
Central bank shows what is priced for each of the 8 banks, meeting by meeting, set against the path a day, a week or a month ago, and says how each bank's pricing is built. Next decisions gives the odds of a cut, a hold and a hike at every next meeting, and marks the banks where the figure is our own estimate. Both are free.
Rate spread turns two banks' pricing into one spread against the pair, across horizons and through government bond yields, and splits a move into the part the spreads explain. Rates across banks tracks repricing, carry and every bank through the day, and US Treasuries carries the curve, the spreads and real yields.
The workspace
Arrange all 49 of them however you work.
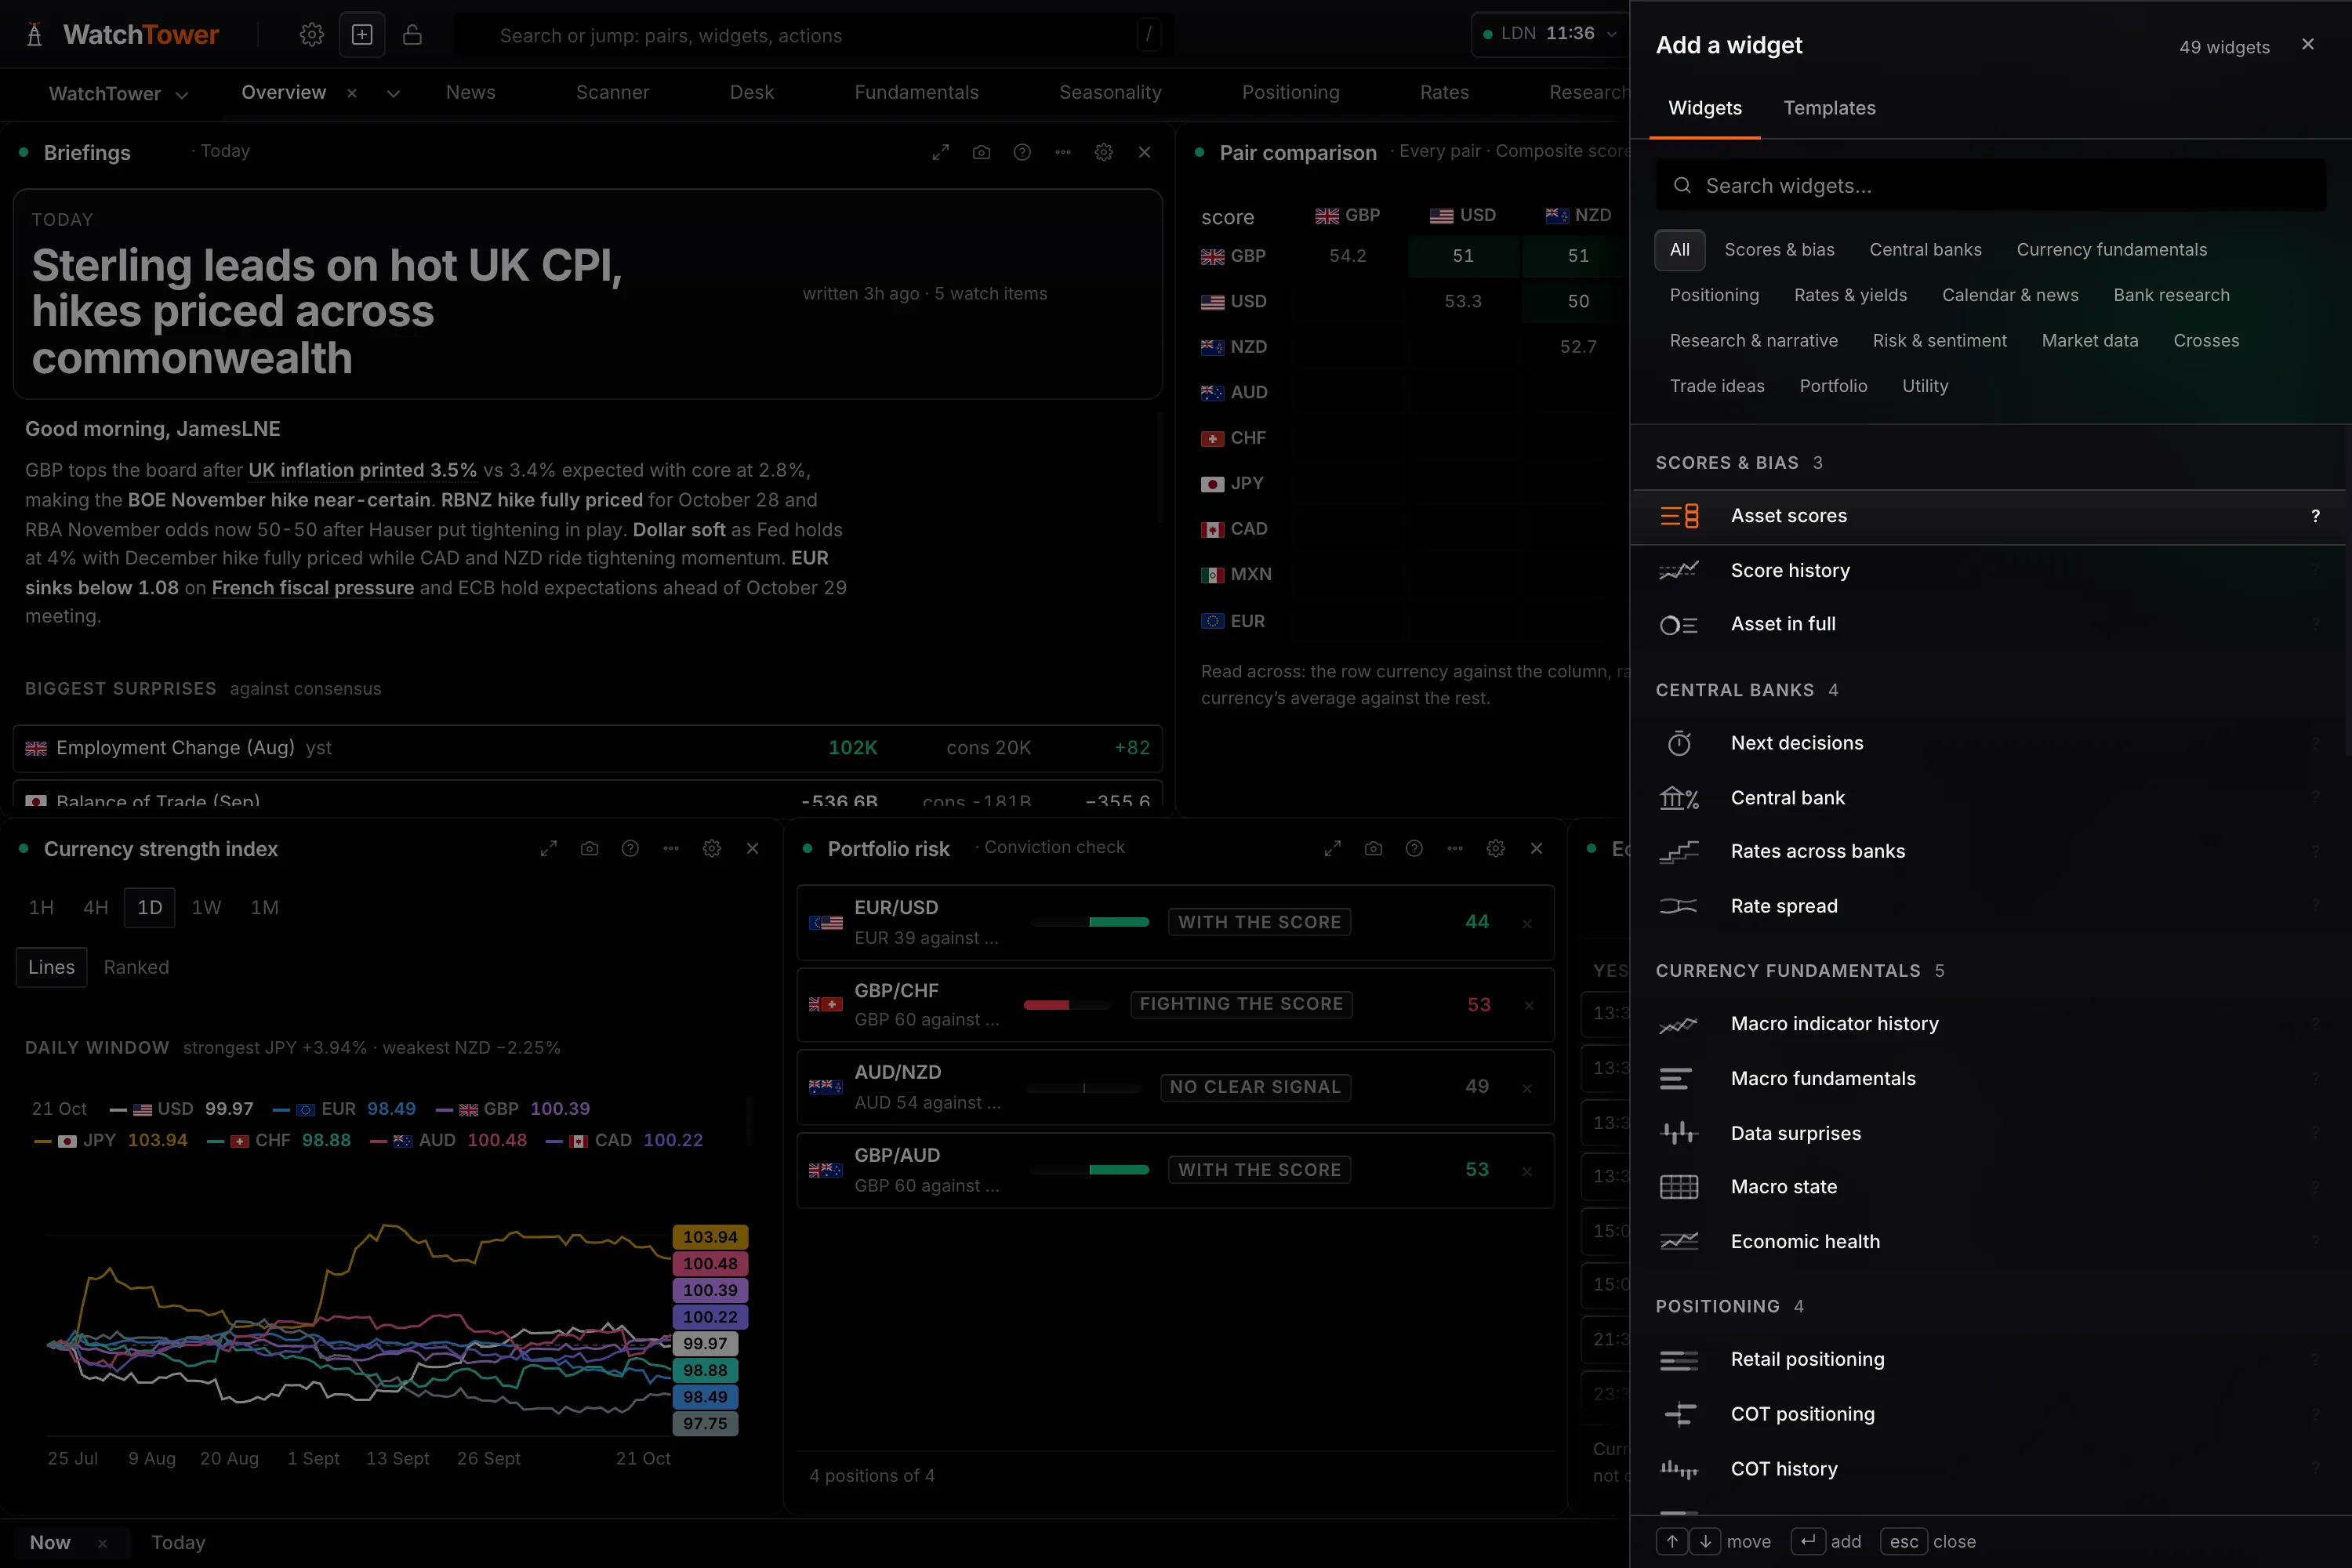
Workspaces hold tabs, tabs hold sections of panels on a grid, and every panel keeps its own settings and its read. Start from one of 28 templates in 7 groups, or drag in what you use and size it. A free account builds 2 boards; Pro has no limit.
Boards are saved to your account and come back the same on any device. Press / or Cmd+K to reach any pair, panel or action from one box, and click any asset anywhere to open its own market page.
Macro data
What each economy is actually doing.
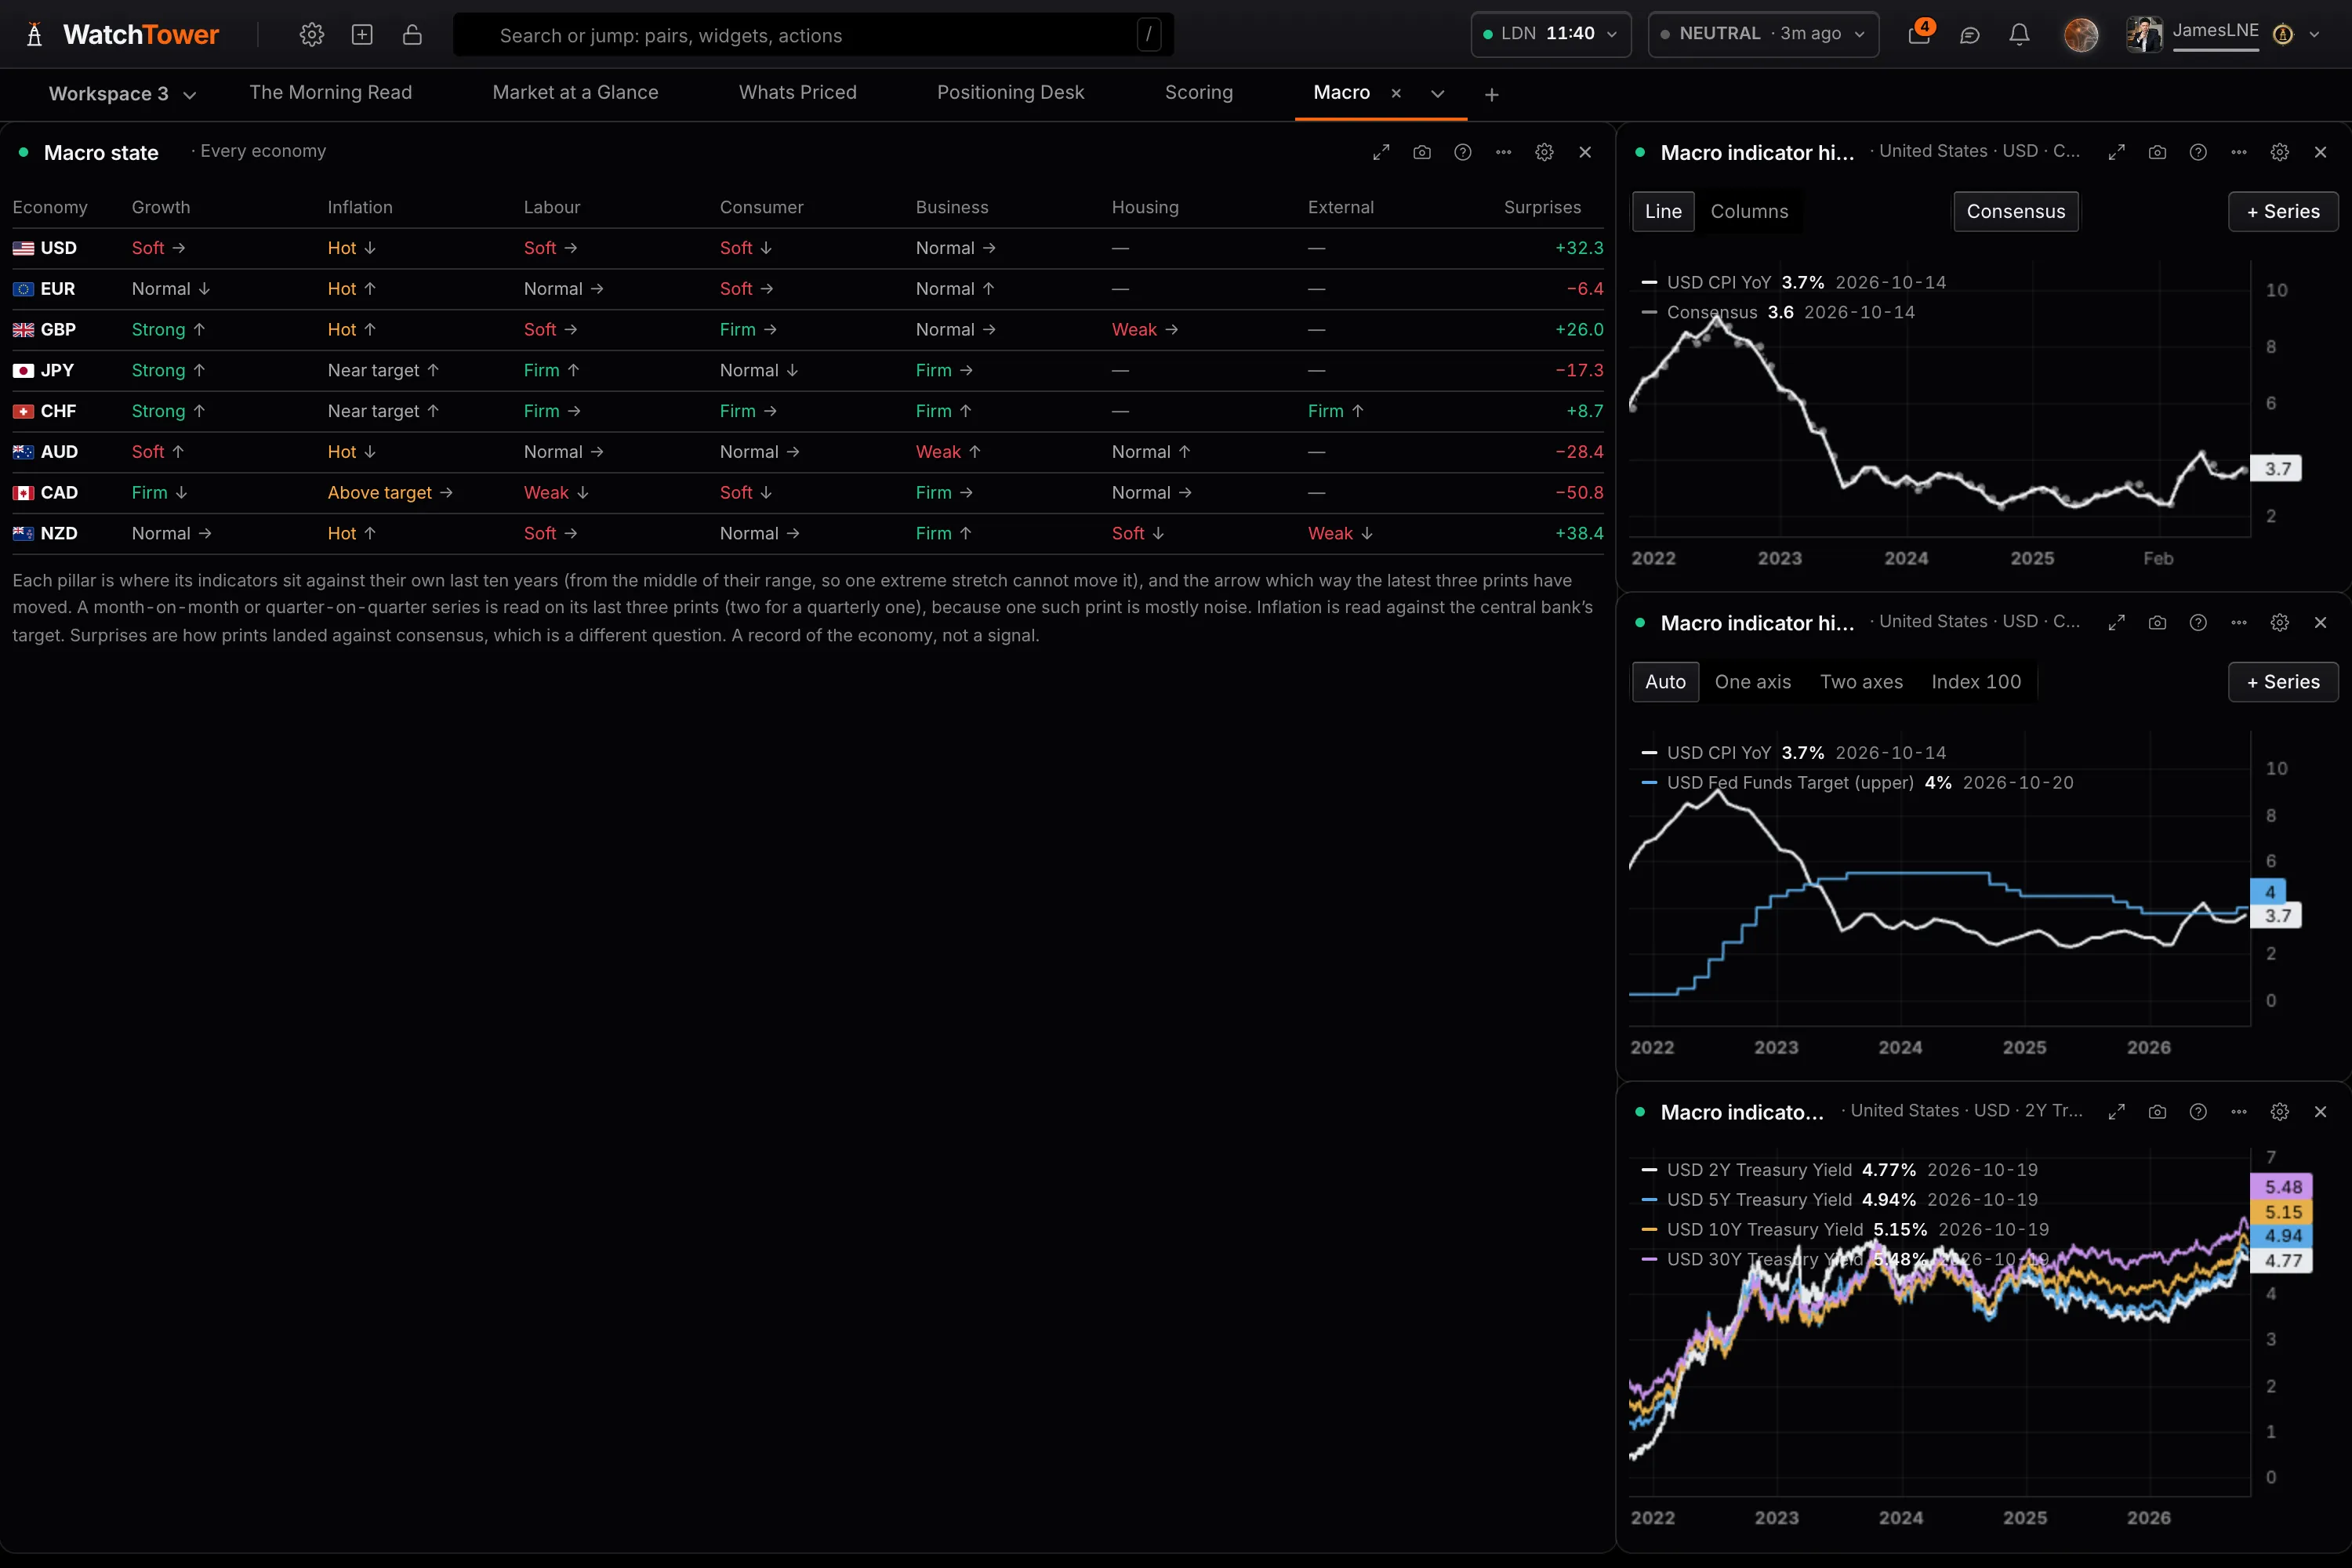
Macro state reads growth, inflation, labour, the consumer, business, housing and the external side against each economy's own ten years, and answers the questions a macro trader asks: is inflation cooling, are rates actually restrictive, does the data justify what is priced. Each answer carries its direction, the evidence for and against, and what it means for the bank.
Data surprises measures how releases are landing against forecasts and whether the pair is following. Economic health scores each economy from 0 to 100, and the Economic calendar, free, carries every release with its number against consensus.
Seasonality
What this market usually does at this point in the year.
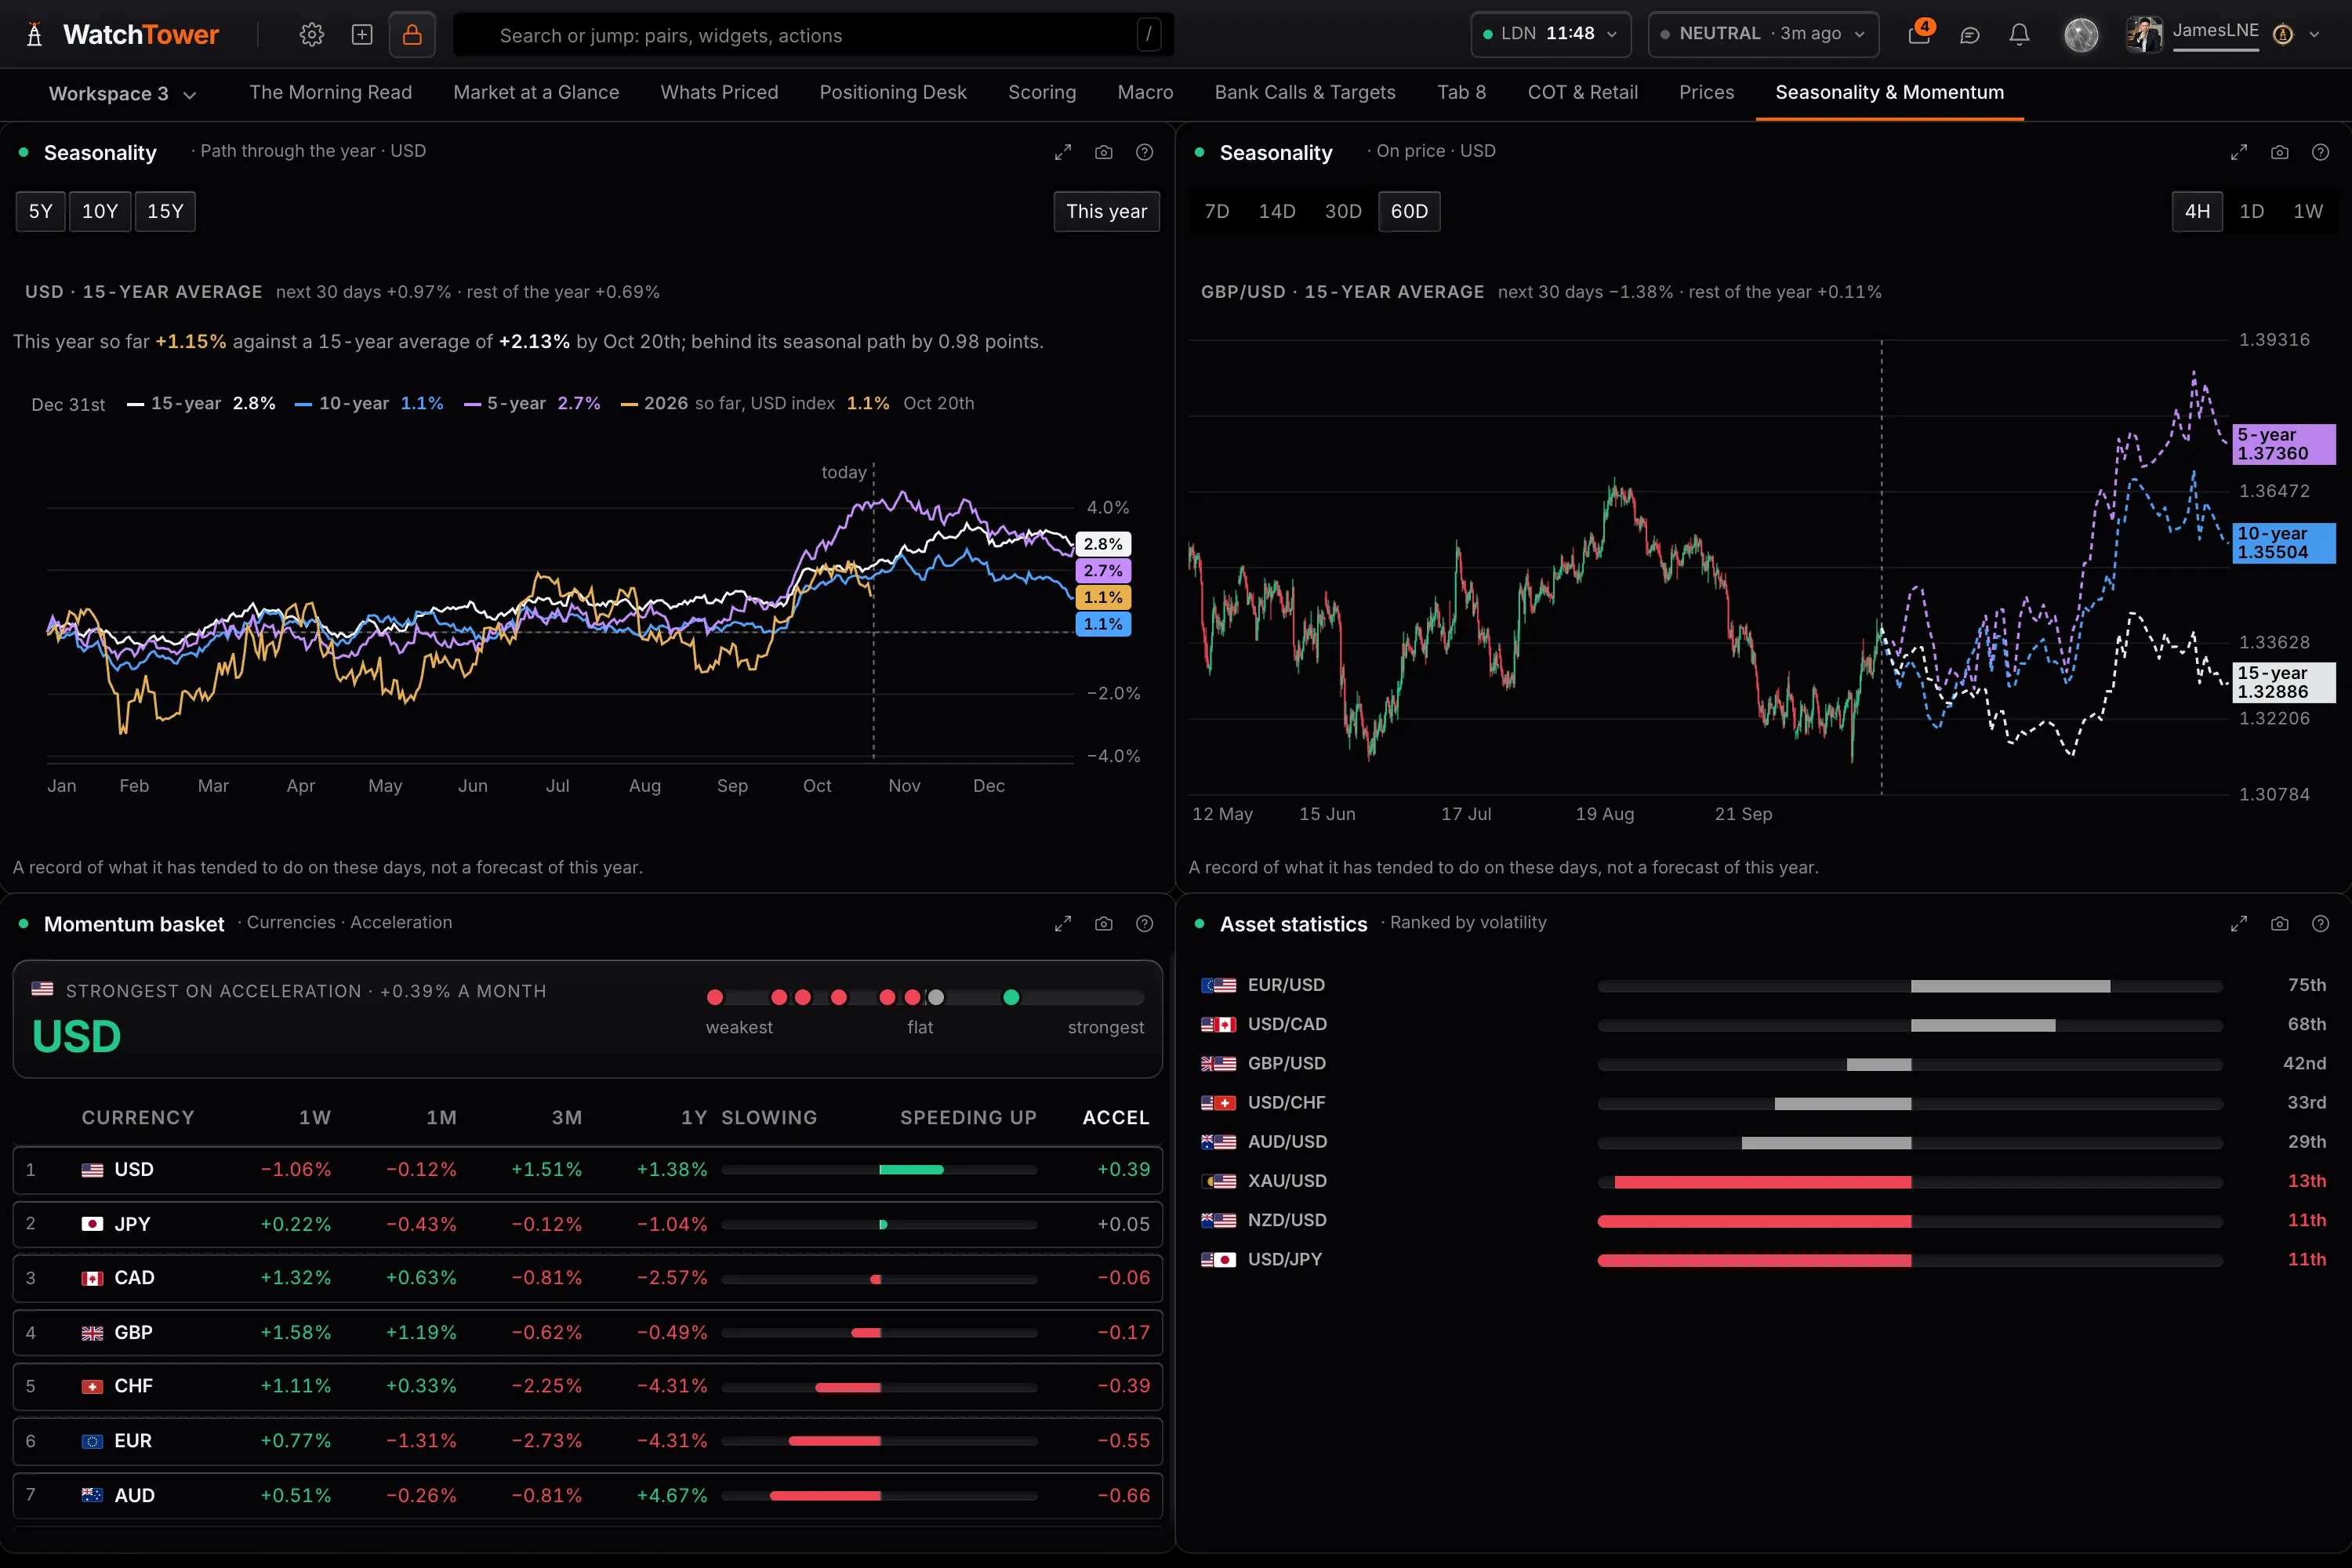
The path through the year over 5, 10 and 15 years, the path ahead from today, the same tendency drawn on the asset's own candles, each month's average, and every asset over the weeks ahead. It carries a defined share of the composite score.
A record of a tendency, not a forecast. It is most useful as a tiebreaker: a setup that agrees with a strong seasonal is a different proposition from one fighting it.
News and geopolitics
Headlines that have been checked before they reach you.
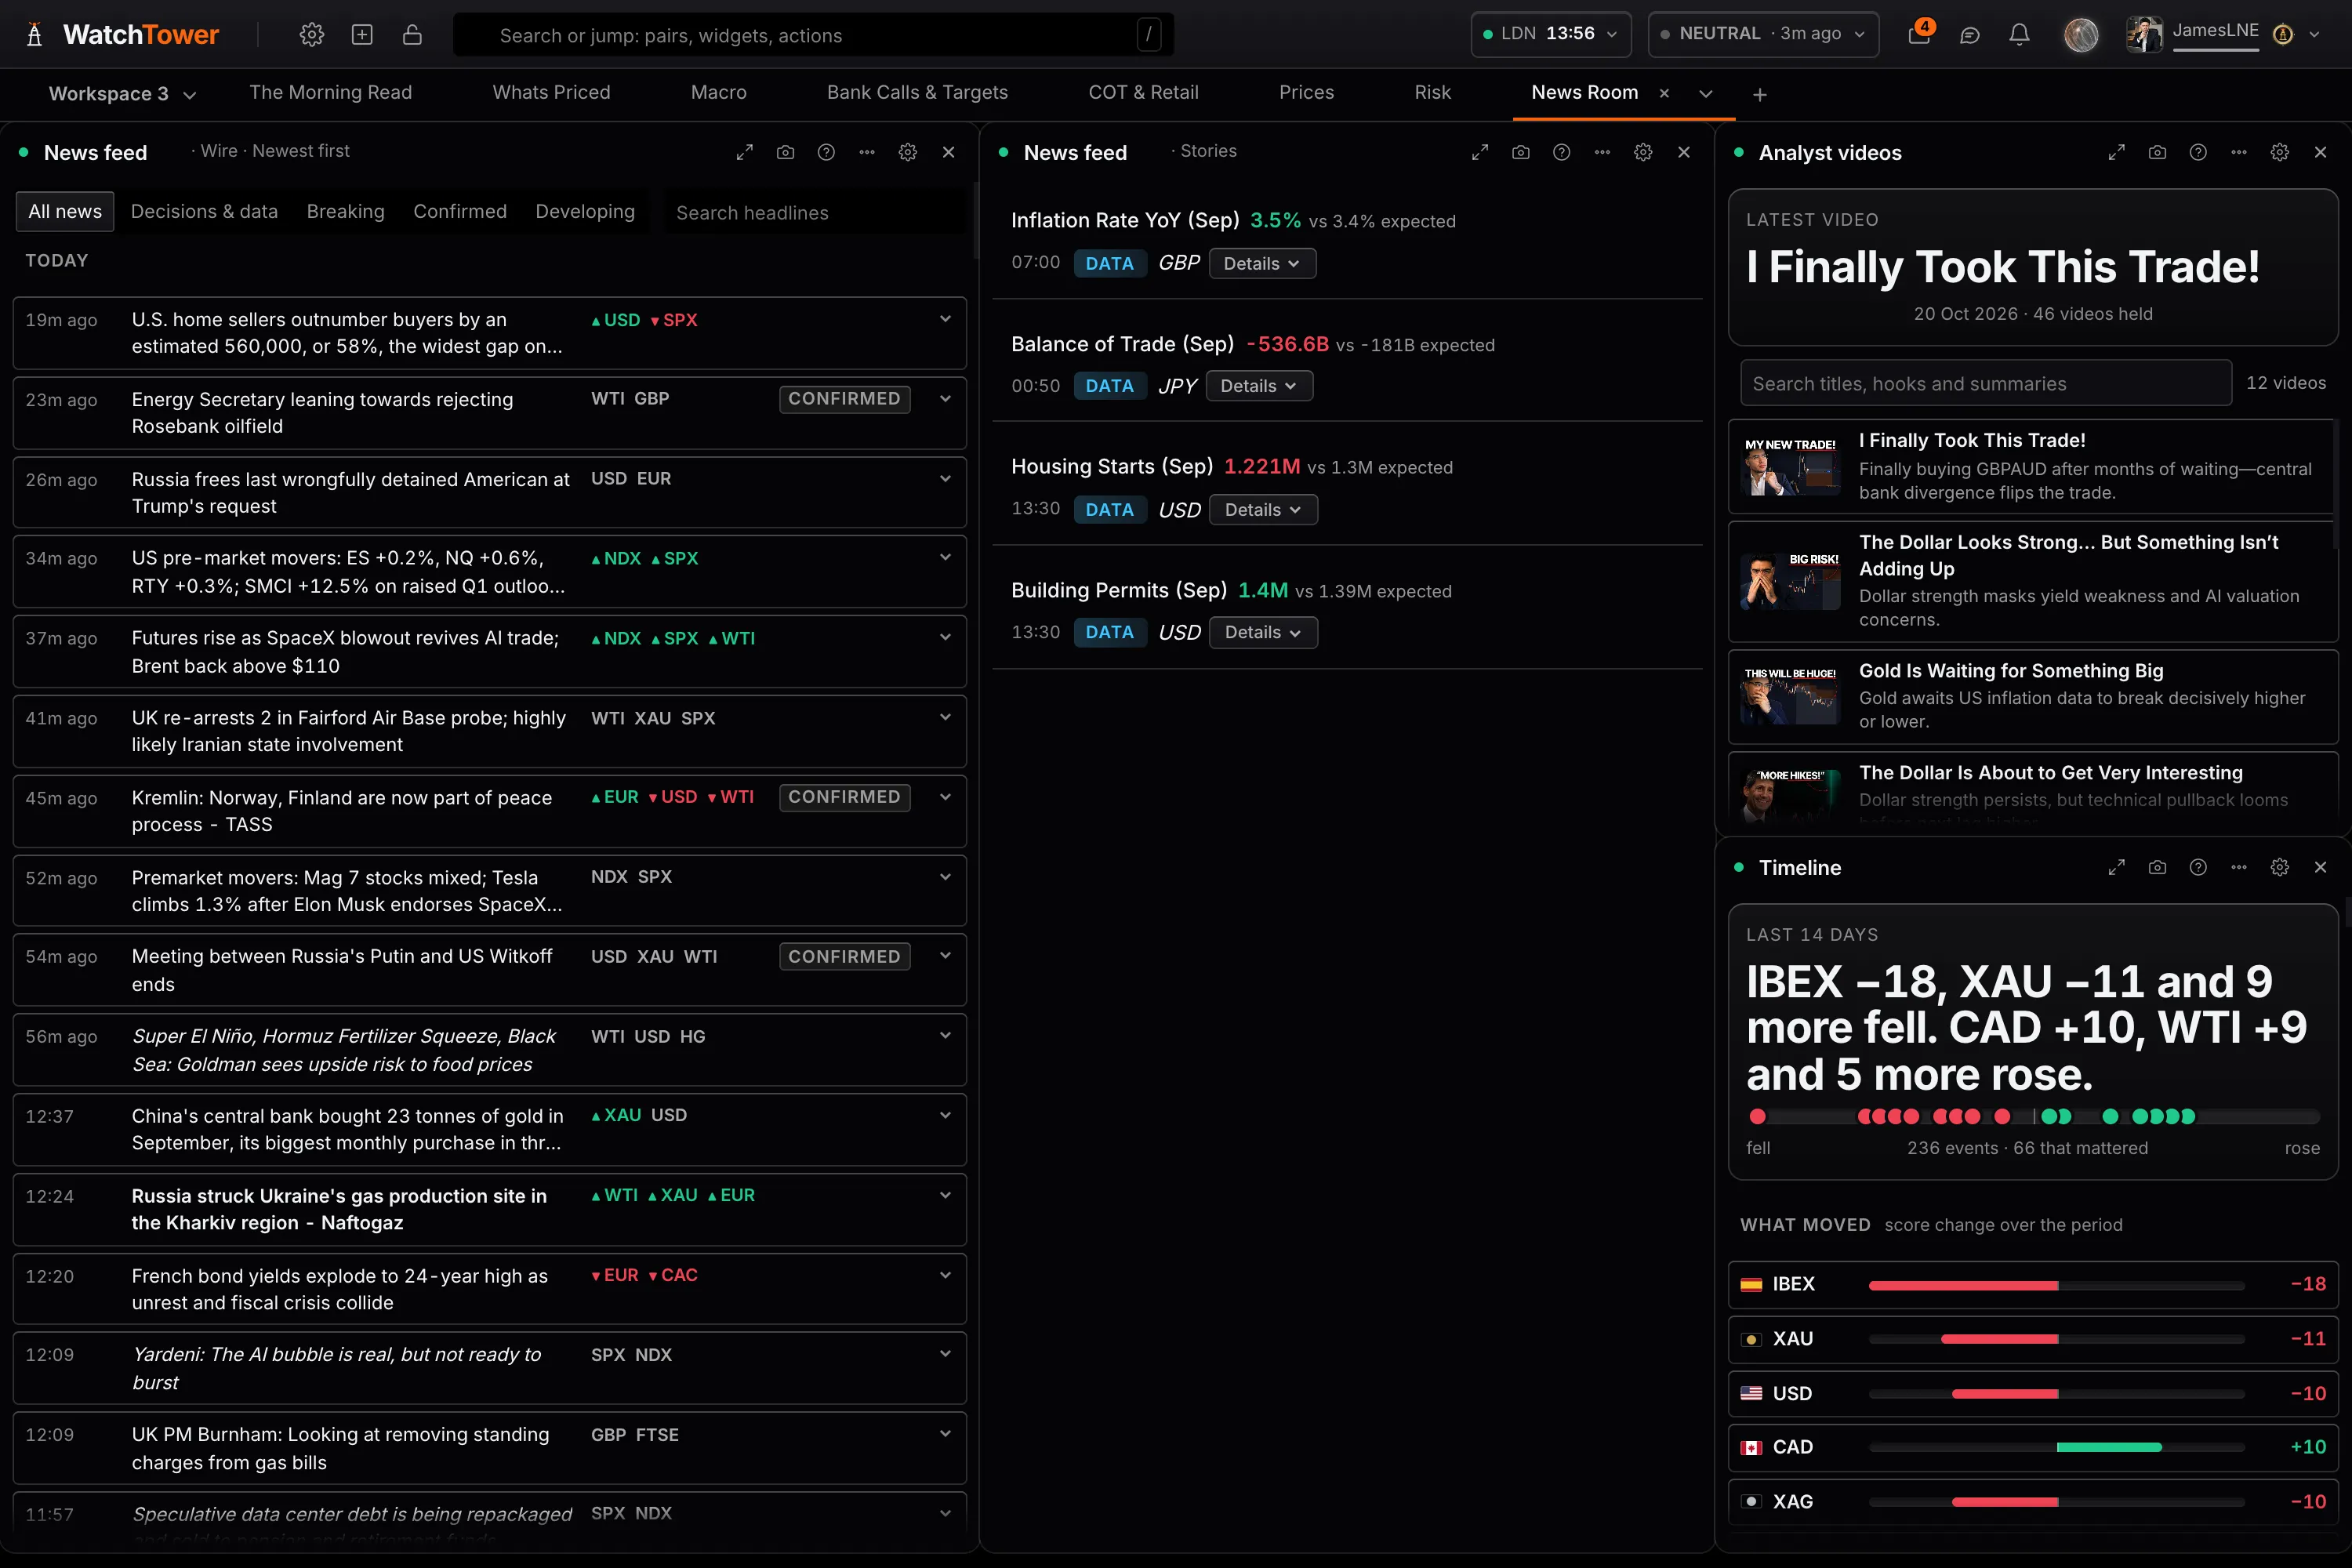
The News feed cross-checks each headline across sources, grades it for impact and tags the markets it moves, with calendar prints and official documents arriving on it too. Read it as the wire, as the stories it has grouped, or by which currencies the news is moving. It is free.
The Geopolitical monitor scores each running situation from 0 to 100 for how much it matters to markets now, on a globe and by region, with the currencies escalation would push. News sentiment reads how the news about one asset is leaning day by day, and the Timeline puts a period's events in the order they mattered.
Charting
The terminal’s own data, drawn on the chart.
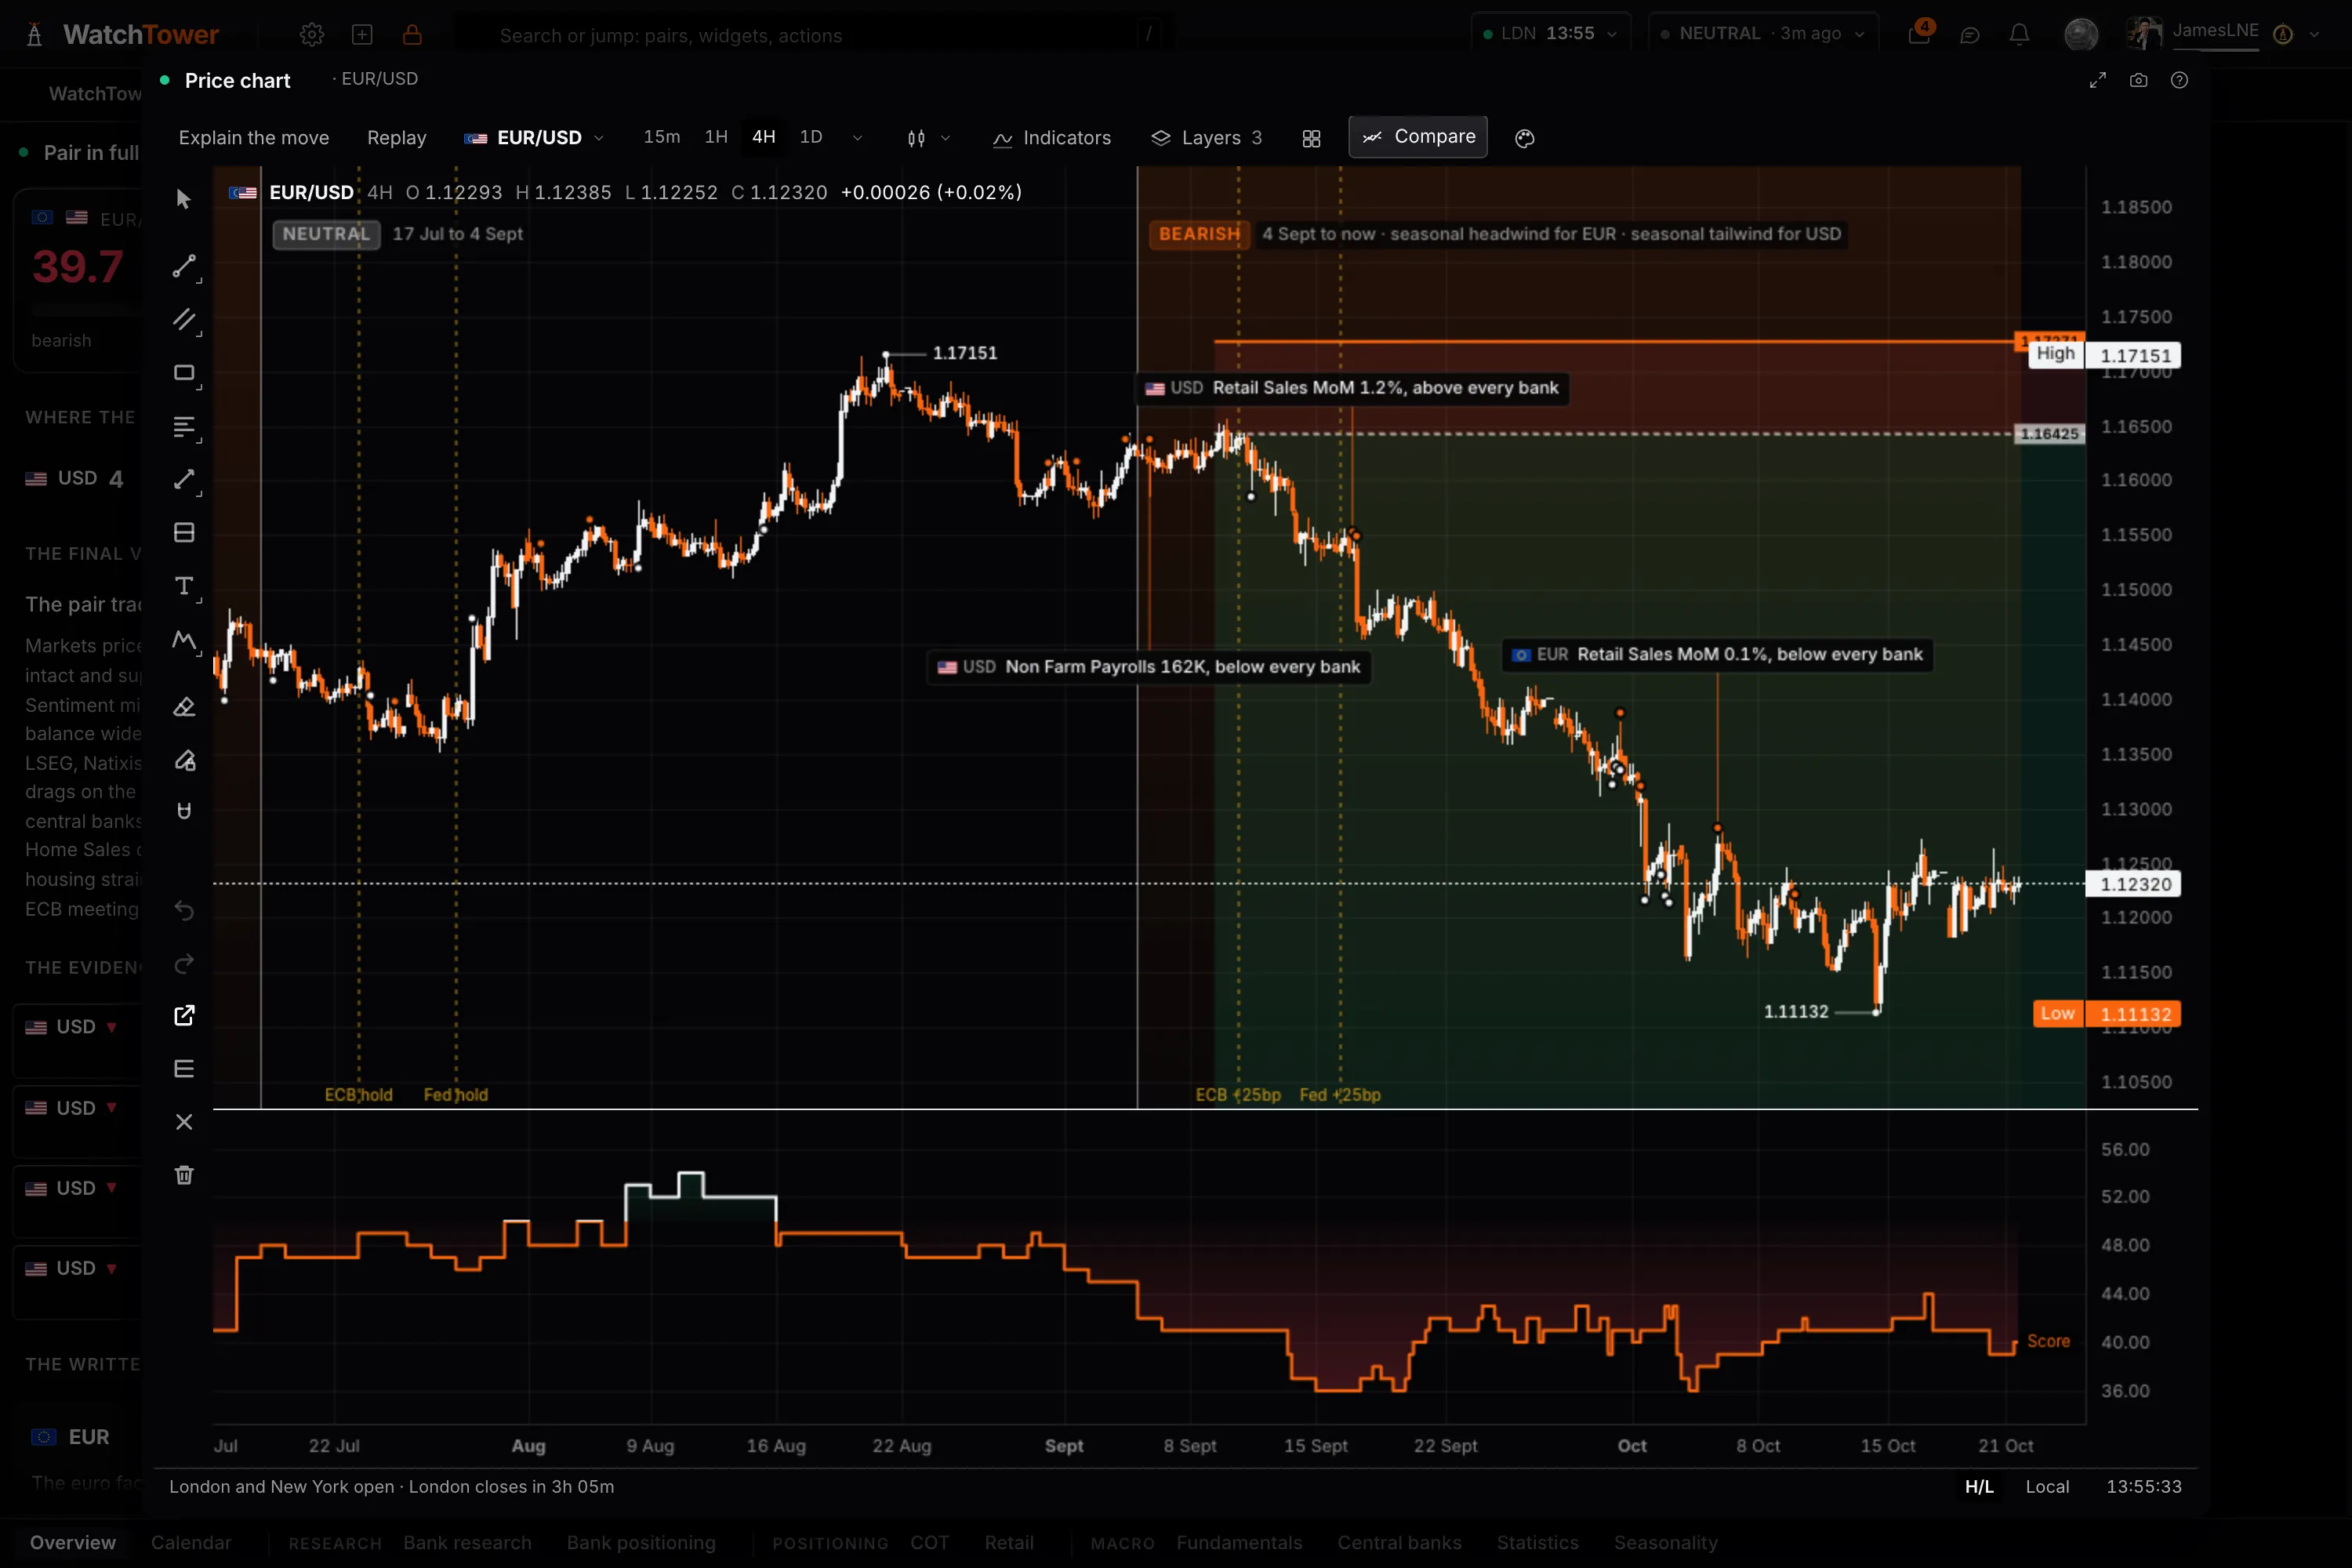
The Price chart carries years of history, up to 16 charts in one panel kept in step, indicators and drawing tools, and layers from the terminal itself: key levels, sessions, headlines and data prints, central bank decisions, COT extremes, the score and seasonality. The chart is free.
Two Pro tools sit on it. Explain the move reads the window on screen and ranks the releases, decisions and headlines by how much of the move happened around each. Replay plays any market forward from a moment in the last year as the terminal knew it then, pausing before each release so you can make the call before you see the reaction.
Sentinel and the Stats library
An analyst that reads the board with you.
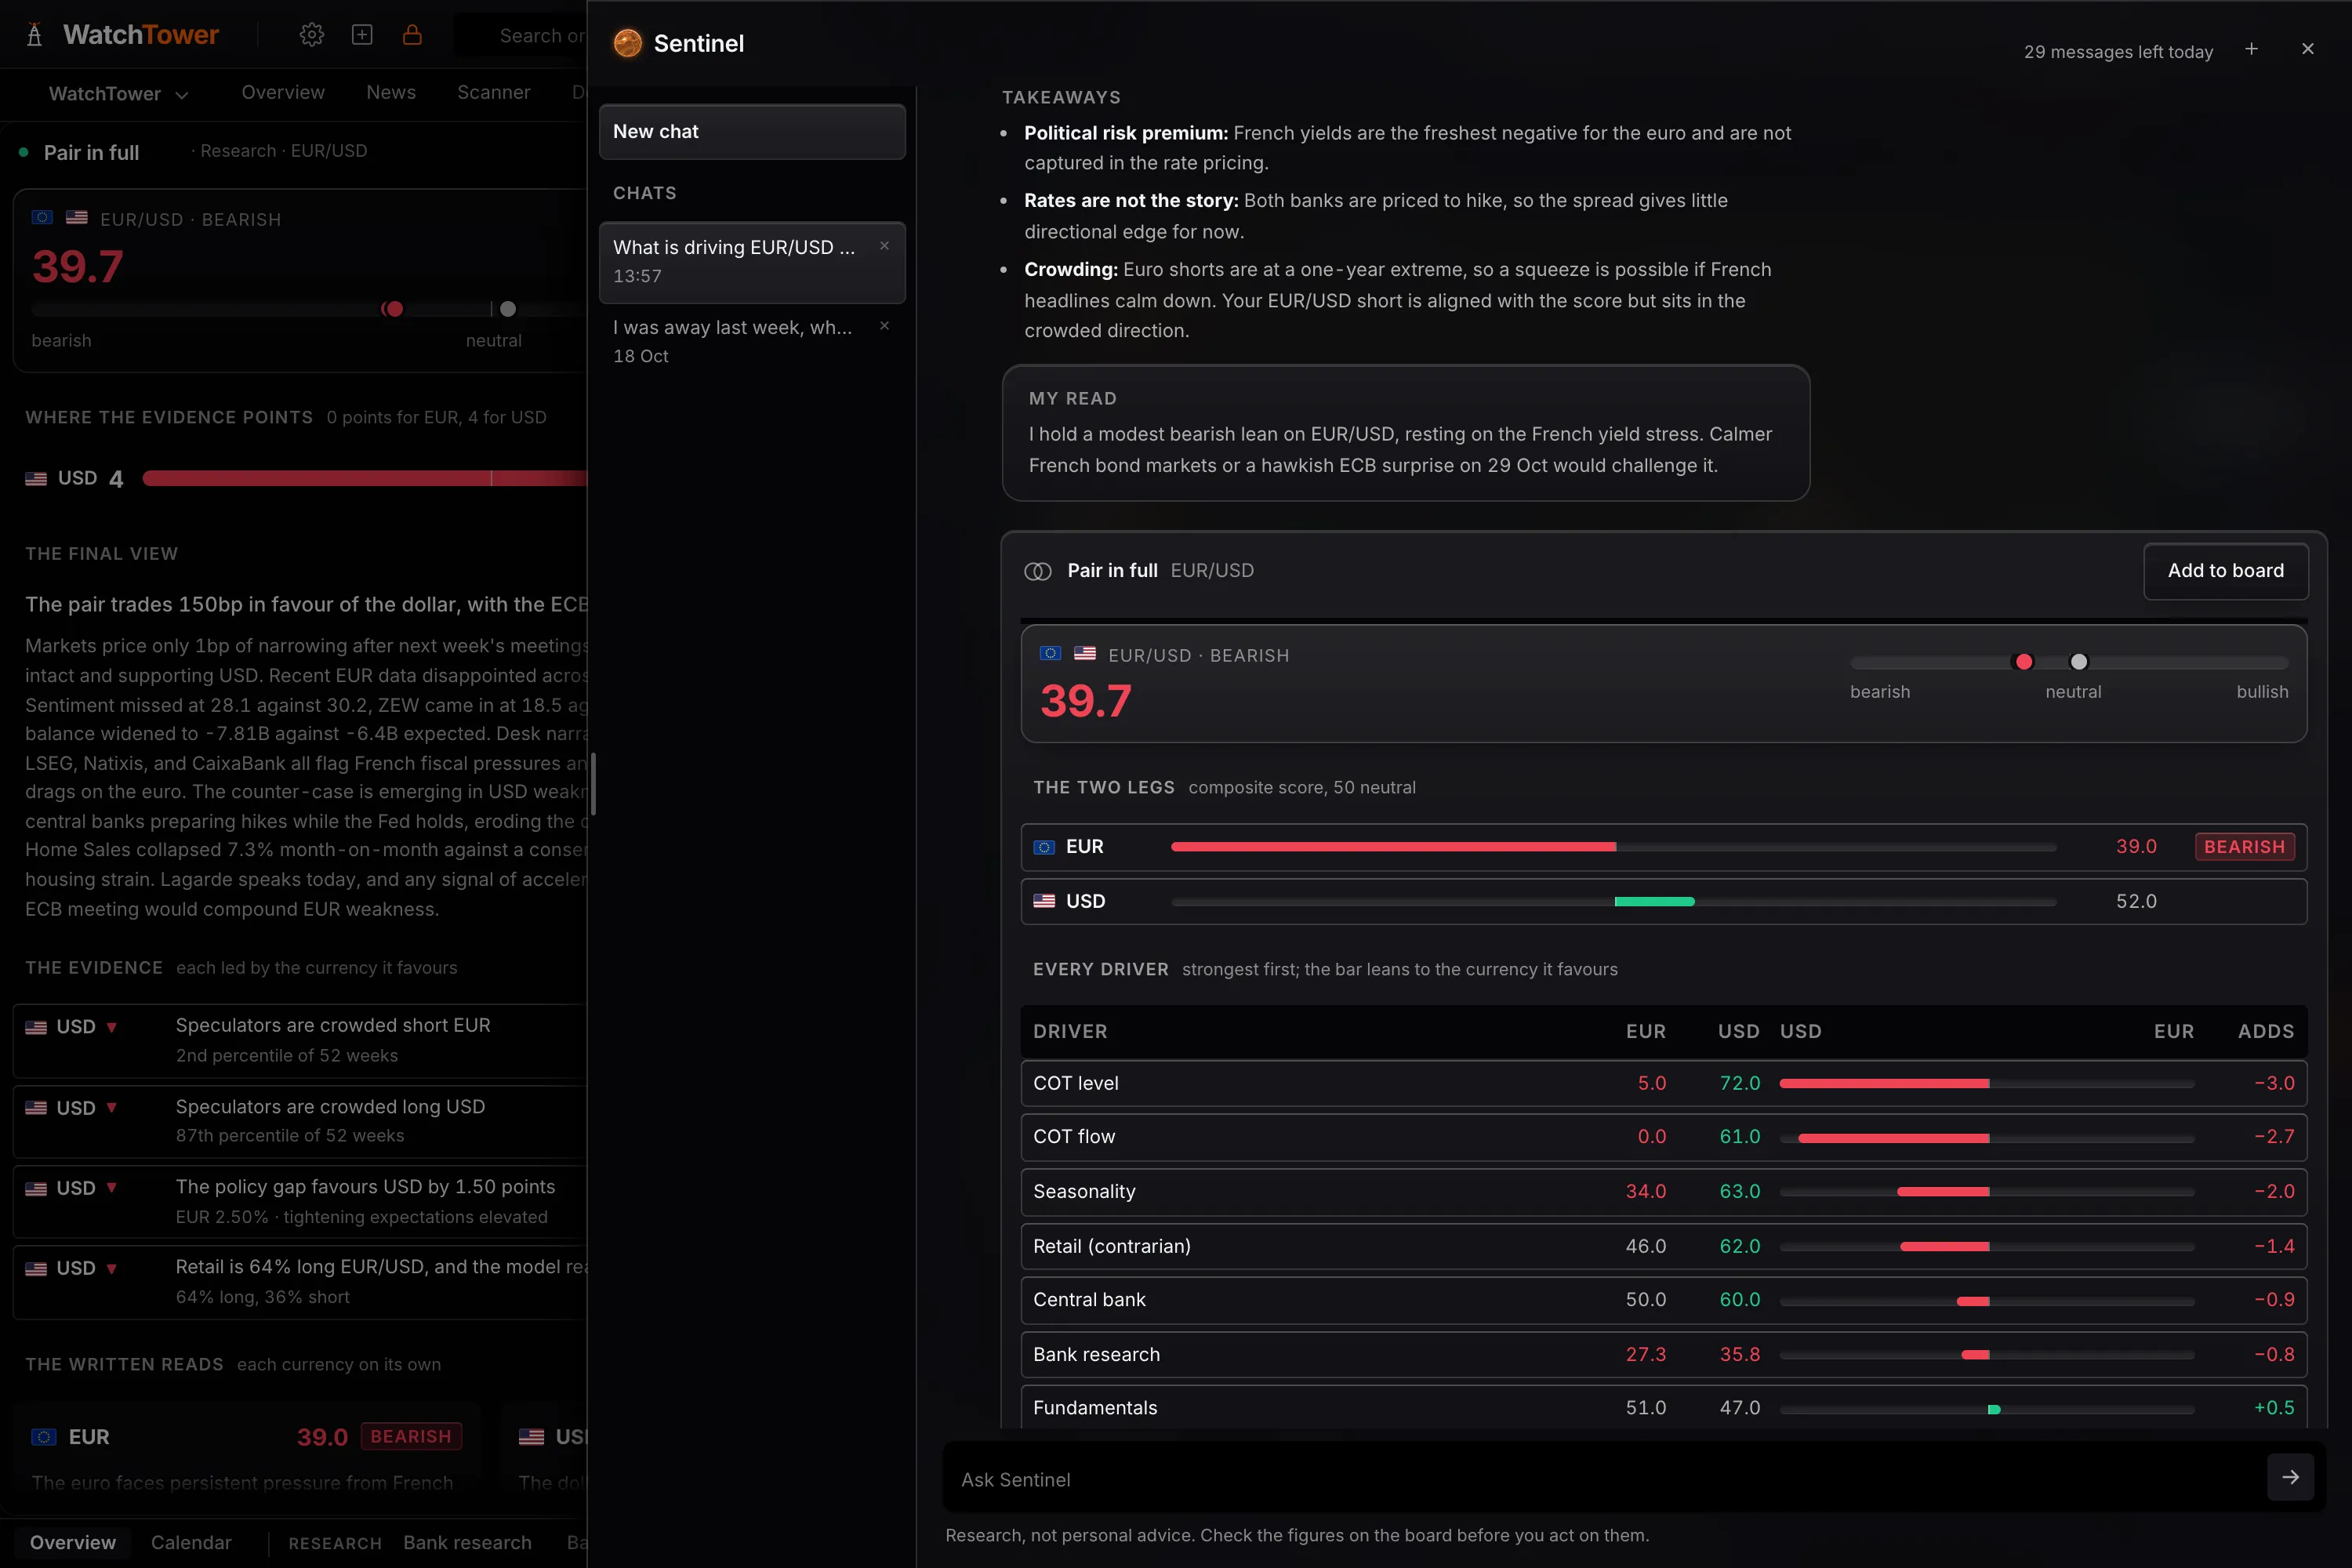
Sentinel reads the terminal's own scores, release previews, central bank pricing, positioning, research and your portfolio, and answers at the level you ask: a line or two for an experienced trader, plain takeaways for a newer one. It shows live panels inside its answers, draws charts with the levels it means, writes trade ideas in three styles and builds boards for you, acting first and offering Undo. Part of Pro.
Ask how often something happens and it runs a study on the terminal's own history: the finding, the sample size, the range and whether it held up. Studies are saved to the Stats library, where members' shared studies can be browsed on any account. What happened over the terminal's own history, not a forecast.
The panel library
All 49 of them, by name.
15 are free on any account and the Stats library is free to browse. The rest are Pro. Under each panel are its reads: one panel answers several questions, chosen in its settings.
Bank research
6 panels 0 free
-
Bank research
ProWhat the research desks are publishing. Read the stream as it lands, filtered by asset, currency, desk, theme, sentiment or conviction; one asset with a row per desk and everything that desk said before kept underneath; or one asset written up as a summary, its drivers and how sentiment has moved.
Reads The stream, One asset by desk, One asset written up
-
Bank trades
ProEvery trade setup the banks have published: direction, entry, target and stop, the reward for the risk, and whether price has reached the entry yet. Open any trade for its rationale and to see it drawn on its own chart.
-
Bank forecasts
ProWhere the banks expect an asset to trade, quarter by quarter: each bank's targets against today's price, their average and the move it implies, and their paths drawn forward on the chart. Or every asset at once, with its average target per quarter.
Reads Targets by quarter, On the chart
-
Data forecasts
ProWhat each desk expects an upcoming release to print, with the median across them and the spread between them. The feed gives one consensus number; this is who is behind it and how far apart they are, which is what decides how a market reacts when the print lands. Coverage follows the research: desks forecast the releases they follow, so a quiet week carries few.
Reads All releases, One release, One desk
-
Research inbox
ProEvery piece of research in one stream, newest first: bank reports, the daily briefs, the weekly report and research write-ups. Open any of them in the panel; open a bank report and break it down into its argument, the subjects it covers and its calls.
-
Bank calls
ProWhere the research desks stand on each asset: how the reports split bullish against bearish, how many desks are behind that, and the calls themselves inside the row with what each desk wrote. Assets covered by a single desk are marked as such.
Scores and bias
3 panels 1 free
-
Score history
ProHow the scores have moved, across assets, five ways: each asset’s composite over its recent runs; what has shifted since a run or ten ago, and which crossed neutral; where the score and the price disagree; which assets lead, fade, lag or improve against the rest; and one market’s bullish and bearish runs on its price chart, with what price did across each and how often it went the score’s way.
Reads Score history, What moved, Against price, Rotation, On the price chart
-
Asset in full
ProOne asset, three ways: its composite, bias, written read, strongest drivers, positioning and structure at a glance; every driver behind the score, its weight and how hard it pulls; or the research desk’s full read.
Reads At a glance, Its drivers, Research
-
Asset scores
FreeEvery monitored asset with its composite score, which way it reads, what it did this week, and the six drivers behind it. Open a row for what each driver is contributing and the weight it carries.
Reads Scores, Every driver
Research and narrative
4 panels 2 free
-
Library
ProEvery central bank document the terminal reads, kept for good: statements with our read, press conferences question by question, opening remarks, and what each bank is reacting to. Search it, filter it by bank or kind, and open a document with its text beside the takeaways.
-
Stats library
Free to browseThe studies members have run with Sentinel: how often, how far, how long, what usually follows. Your own saved studies and the ones members shared, credited to their Squawk name. Filter by asset, currency, kind and timeframe, refresh a study when new data is in, or create a new one with Sentinel.
-
Briefings
FreeThe house’s written briefings in one panel: today’s need-to-know with its watch items; the EU or US session report in full; the week’s editorial and theme; and the weekly report with its pair ideas.
Reads Today, Session report, This week, Weekly report, My book
-
Analyst videos
FreeThe daily video desk: the latest video, a search over titles, hooks and summaries, every video as a row or a thumbnail, and a video opening in place with its summary and takeaways.
Reads Rows, Thumbnails
Calendar and news
3 panels 2 free
-
News feed
FreeMarket news headlines as they land, each with its time, how far it is confirmed and the currencies it touches; the stories grouped together; and which currencies the news is moving.
Reads Wire, Stories, By asset
-
Timeline
ProWhat happened over a period, in the order it mattered: the verdict, every asset's score move, and the events that mattered day by day, each with the driver behind it.
-
Economic calendar
FreeEvery release in the window in the order it happens, with now marked: what has landed carries its number against consensus, what has not carries how long until it does. Filter by impact, or rank by the biggest surprise.
Reads Agenda, Week grid, Event risk by currency
Currency fundamentals
5 panels 0 free
-
Economic health
ProIs an economy healthy, normal, at risk or in recession territory? One score from 0 to 100 for each of the eight economies, from GDP, unemployment (the Sahm rule), the PMIs, retail sales and industrial production, each judged against its own line or its own ten years, with the score's history and every indicator charted against its bands.
-
Macro state
ProWhat each economy is actually doing, apart from whether its prints beat consensus: growth, inflation, labour, consumer, business, housing and external, each against its own ten years and which way it is moving, beside the surprise index. Or one economy's questions, the ones a macro trader asks (is inflation cooling, are rates actually restrictive, does the data justify what is priced), each answered with its direction, the evidence for and against, what changed and what it means for the bank, the most pressing first. Or one economy's last six prints of every indicator as a heat table, with the older four, the newer two and all six averaged beside them. Or one economy against another: every pair ranked by how far apart the two are and how that gap has moved, or one pair pillar by pillar with the gap through the years against the price.
Reads Every economy, One economy, Questions, Prints, Every pair, One pair
-
Data surprises
ProHow each currency’s economic data has landed against forecasts, and the releases behind it; which pairs are following the gap in their data; and one pair in full. Weighted by each release’s importance and how recently it printed.
Reads Data against forecasts, Is price following the data, One pair in detail
-
Macro fundamentals
ProThe macro picture behind the currencies. Read the fundamentals score each one carries, the indicator grid that score is rolled up from with currencies across and indicators down, or every scored release for a single asset with what it printed, what was expected and the engine’s read on each.
Reads The fundamentals score, Indicators across currencies, One asset in full
-
Macro indicator history
ProAny currency's economic indicator as a chart: compare series across currencies, rescale them, switch between line and columns, and read every value under the crosshair.
Reads Line, Columns
Risk and sentiment
3 panels 1 free
-
News sentiment
ProHow the news about one asset reads: bullish, neutral or bearish in the last 24 hours and day by day, from how many articles, against its past week, with price alongside. A day opens its articles and the reason each was read that way.
-
Risk regime
FreeWhether the market is risk-on or risk-off: the composite reading, the signals behind it and what each one contributes, and the raw prices those signals are built from. Read it as a score with its signals, the contributions alone, a table, a headline for a small tile, or switch to the assets behind it as prices, sparklines, a 24h heatmap or winners and losers.
Reads The regime, The assets behind it
-
Geopolitical monitor
ProLive geopolitical and macro situations, scored 0 to 100 for how much each matters to markets now: ranked, on a 3D globe, by region, and which currencies escalation would push. Opening one gives what drives it, what it moves and the intelligence behind it.
Reads Situations, Globe, Exposure, By region
Crosses
2 panels 0 free
-
Pair comparison
ProHow two currencies compare. Read one pair spelled out side by side, as a shape overlay or as a spread table; every pair at once as a matrix, the strongest edges or edge bars; or a pair’s score run by run as a trajectory, a change over a window, or a table.
Reads One pair, Every pair, Over time
-
Pair in full
ProOne pair in full: its score and bias, both legs, every driver behind it, the research, and what is coming for it on the calendar, with what moves it and how its releases come in.
Reads At a glance, Research, Calendar
Trade ideas
2 panels 0 free
-
Trade scanner
ProEvery tradable read the engine holds in one ranked list: the crosses and every metal, commodity and index scored on its own. Leads with the side, then the score, its change since the last run, its trend, the seven drivers as a strip with how many agree, and the carry. Sort by any column, filter to the tiers you want, narrow to a shortlist where four or more drivers agree, or open the full table.
Reads Driver strip, Shortlist, Full table
-
Momentum basket
ProThe board ranked by how far it has moved over a week, a month, three months and a year, and by acceleration: whether the recent pace is running ahead of its own year. A record of what has happened, not a signal.
Rates and yields
1 panel 0 free
-
US Treasuries
ProThe US Treasury curve and its history in one chart: the curve against a week, a month or three months ago, the key spreads (2s10s, 3m10s, 5s30s) and their history, real yields against CPI, and any maturity through time back to 1962 for the ten year.
Reads Curve, Spreads, Real yields, History
Market data
6 panels 2 free
-
Asset statistics
ProWhat the bars say. Read one asset in depth with its statistics panel, volatility term structure, return distribution and day-of-week or monthly bias; or every asset ranked by how busy it is against its own history; or how they all move against each other as a matrix or a list of the tightest pairs.
Reads One asset in depth, Ranked by volatility, How they move together
-
Live prices
FreeWhat is moving right now, from the live tick stream. Every instrument with its price and the day’s change, the biggest movers ranked out of it, or each currency scored across every pair it trades in. Values stream live and flash on each tick.
Reads Every instrument, Biggest movers, Currency strength, Scrolling tape
-
Seasonality
ProWhat any asset has tended to do on these calendar days in past years: the path through the year over 5, 10 and 15 years, the path ahead from today and on the asset's own candles, each month's average, and every asset over the weeks ahead. A record of a tendency, not a forecast.
Reads Path through the year, Ahead from today, On price, By month, Across assets
-
Currency strength index
ProRelative currency strength over time, each currency indexed to 100 at the start of the window: as lines, or ranked by where each finished. Pick the currencies and the timeframe, from hourly to monthly.
Reads Lines over the window, Where each finished
-
Index breakdown
ProWhat is inside an equity index and what each name is worth to it: who carries it by weight, which names moved it today, breadth by count and by weight, the sectors, and how the heaviest names have reported. Honest about partial lists.
Reads Who carries it, What moved it today, Breadth, Sectors, Earnings
-
Price chart
FreeWatchTower native chart. 44 assets: FX, metals, commodities, indices. Candles, area or line, across 5m to 1M timeframes. Explain the move reads what carried the move on screen; Replay plays any market forward from a moment in the last year, as the terminal knew it then: the releases as they landed, the wire as it was graded, and the scores and pricing at the close before.
Utility
4 panels 4 free
-
Tutorials
FreeThe WatchTower walkthrough in short parts: starting a board, panels and their settings, tabs, search, Sentinel, your account, and finding a trade. Each part plays in place from its own start to its own end, and the ones you have watched are ticked.
-
Market hours
FreeWhether the FX market is open and how long until that changes, how far through the trading week we are, and the Sydney, Tokyo, London and New York sessions: today's timeline with the overlaps, each session's local time and its next open or close.
-
Data freshness
FreeWhether every data feed behind the board is current: all current, or how many are due or behind, each feed's age against what it is expected to do. Tells you whether a quiet panel is quiet because the market is, or because its source has stopped.
-
Live TV
FreeA live news channel in the panel: pick a provider from the list on the panel, the ones streaming now marked green. Play, pause and volume; no timeline. Starts muted; press the speaker to hear it.
Portfolio
2 panels 1 free
-
Portfolio risk
ProHow your book is positioned, five ways. Net currency exposure once the pairs are broken into legs, how concentrated that is and how many independent bets it really holds, whether each position agrees with its own score, what has moved under it since a chosen run, and how it sits against retail and the specs.
Reads Net exposure, Concentration, Conviction check, What has moved, You vs the crowd, Correlation, Coming up
-
My portfolio
FreeYour book in one panel: add positions and set each long or short, with live price and day move, the score and the engine's lean, and whether it agrees with your side. Open a position for the drivers behind its score and its final view, or switch to the live price list.
Reads Positions, Live prices
Positioning
4 panels 0 free
-
Retail history
ProOne pair or one currency in depth, from the retail brokers’ books. A pair’s crowd over time, one pair in full with where each side got in against the last close, or one currency across every pair it trades in. For every asset at once, use Retail positioning.
Reads One pair over time, One pair in full, One currency across its pairs
-
COT history
ProOne currency or one pair in depth, from the CFTC reports. Its speculative position over time, week by week with the weeks it flipped side, a pair’s two legs against their own years, or which currencies’ positioning moves together. For every asset at once, use COT positioning.
Reads One currency over time, One currency week by week, A pair’s two legs, Which move together
-
COT positioning
ProEvery asset with its net speculative position, what it did against the prior report, and where that sits in its own 52-week range. Rank by the move, by how crowded it is, or by size, and filter to the crowded end or to the assets that flipped side.
-
Retail positioning
ProEvery asset with the retail crowd’s long and short split, how one-sided it is, where the futures speculators sit against it, and what a contrarian read implies. Thin reads built from a single book are marked as such.
Central banks
4 panels 2 free
-
Rate spread
ProRates against a pair. Its two central banks' priced rates as one spread, at the policy rate and 3, 6 and 12 months out, or its 2-year and 10-year government bond yields, day by day with the pair beside them: the moves over 1, 5 and 20 days, how closely the pair has followed and how far it moves per 10bp. Or the gap at 1, 3, 6, 9 and 12 months out against a week ago, and whether its move is gaining or losing pace. Or the pair's recent move split into the part the rate spreads explain and the part they do not.
Reads Spreads and the pair, Across horizons, What moved the pair
-
Central bank
FreeOne central bank in full, four ways: what the market prices for it, the next meeting and the path from here, set against the path a day, a week or a month ago or on any day held, with each meeting's change in basis points; its latest decision, with the statement, what changed from the last one and the documents; its rate, inflation, real rate, stance and guidance; and how its rates compare with the other banks.
Reads What’s priced, Latest decision, Rate and stance, Against its peers
-
Next decisions
FreeEvery central bank's next decision three ways: what is priced for it, with the odds of a cut, a hold and a hike; when each lands over the next six weeks; and which banks lean hawkish or dovish, on twelve months priced, the next meeting, or the real policy rate. Banks with no traded instrument behind them are marked as our own estimate.
Reads Next decisions, The next six weeks, Hawk to dove
-
Rates across banks
ProEvery central bank side by side, four ways: where policy rates stand, with inflation and the real rate; how they got there, as steps over the years; how far the market has repriced each bank’s path over a week, a month or a quarter; every bank's pricing through the day, with each release and what it moved; and the carry in every pair, on nominal, real or forward rates.
Reads Policy rates, Rate history, Rate history and the path priced, Repricing, Priced 3, 6 and 12 months ahead, What each bank is reacting to, Intraday, Carry
The usual ones.
How many panels does WatchTower have?
49 panels across 14 categories, all named on this page, with 133 reads between them: a panel answers several questions, chosen in its settings. 15 are free on any account and the Stats library is free to browse. The rest are Pro, and every account starts with 14 days of Pro.
What markets are covered?
9 currencies: USD, EUR, GBP, JPY, CHF, AUD, CAD, NZD and MXN. 6 metals and energy markets: gold, silver, platinum, palladium, copper and WTI. 9 equity indices: S&P 500, Nasdaq 100, Dow, DAX, FTSE 100, CAC 40, Euro Stoxx 50, IBEX 35 and Nikkei 225. 8 central banks: the Fed, ECB, BoE, BoJ, SNB, RBA, BoC and RBNZ.
Whose research is read?
A roster of 48 institutions, including ING, MUFG, UniCredit, Westpac, Danske Bank, Crédit Agricole CIB, SEB, Scotiabank and others. Each report is read and broken down into its argument, direction, conviction, levels and horizon, then compared with every other desk covering the same market.
Can I build my own layout?
Both plans build their own. A free account gets 2 boards from the 15 free panels; Pro gives you all 49, as many workspaces and tabs as you need, and the same 28 templates to start from.
What is Sentinel?
The AI analyst inside the terminal, part of Pro. It reads the terminal's own scores, central bank pricing, positioning, research and your portfolio, answers at the level you ask, runs statistical studies on the terminal's history, writes trade ideas and builds boards for you. Up to 30 messages a day.
Does it give trade signals?
No. It describes data and shows the macro read with the reasoning behind it. It never gives an entry, a stop or a position size. Those decisions stay yours.
In short
WatchTower Terminal is built from 49 panels across 14 categories, arranged into boards, and most panels answer several questions through the reads in their settings. The categories are Bank research, Scores and bias, Research and narrative, Calendar and news, Currency fundamentals, Risk and sentiment, Crosses, Trade ideas, Rates and yields, Market data, Utility, Portfolio, Positioning, Central banks. A free account uses 15 of those panels on 2 boards it builds itself, and can browse the Stats library; Pro at $49 a month opens all 49, Sentinel the AI analyst, Replay and Explain the move, and lifts the board limit. Coverage is 9 currencies, 6 metals and energy markets and 9 equity indices, with 8 central banks priced.