Two crowds, pointing opposite ways, read opposite ways.
Speculative futures positioning and the retail crowd are different measures of the same market, and they are not read the same way. WatchTower carries both across 44 markets, each with the percentile that says whether the number is actually unusual, and sets them on the same screen.
The distinction
Which crowd, and which way to read it.
Speculators
- Who
- Managed money and other large reportable accounts
- Source
- CFTC Commitment of Traders, published weekly
- Updated
- Tuesday snapshot, released Friday afternoon
- How to read it
- Read with the trend. A large net long is a positioned market, not automatically a doomed one. It matters most at an extreme, where there is nobody left to add.
The retail crowd
- Who
- Aggregated retail broker books
- Source
- Aggregated broker positioning, updated through the day
- Updated
- Intraday
- How to read it
- Read against the trend. This is the input the composite score applies contrarian, at a weight of 10%.
Depth
The number, or the reading.
The panels
Four panels, on Pro.
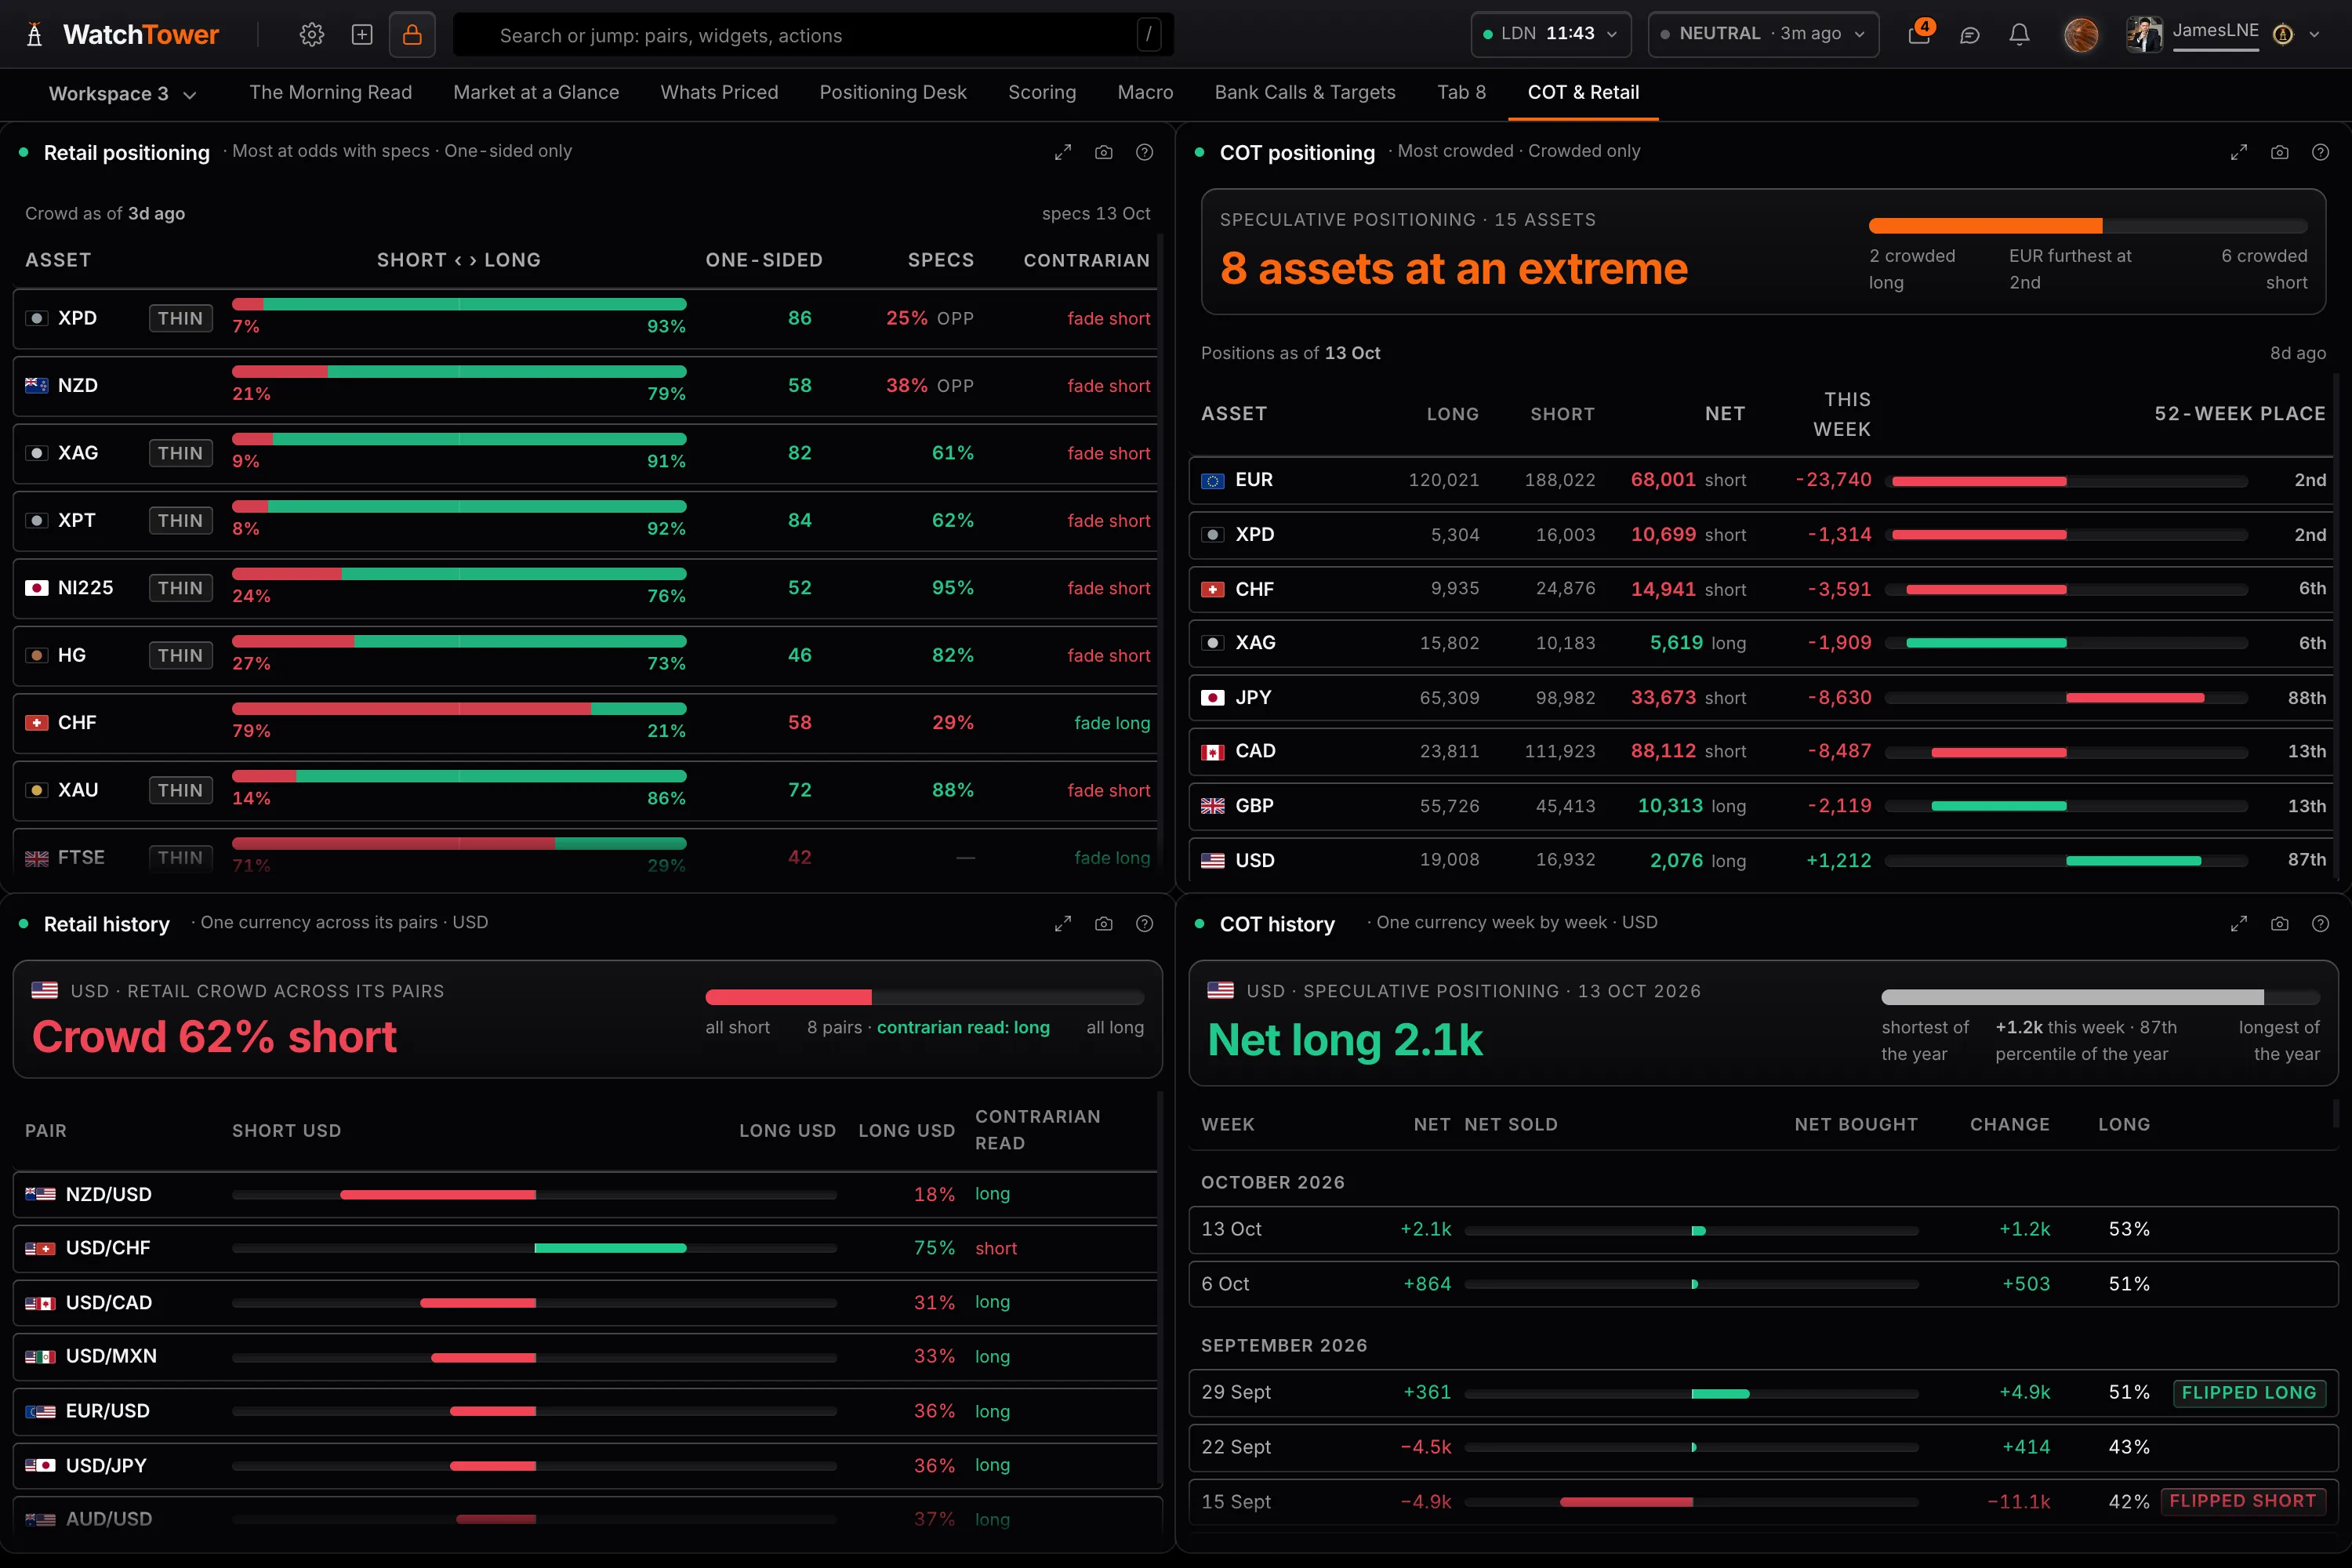
- COT positioning. Every asset with its net speculative position, the change against the prior report, and where it sits in its own 52-week range. Rank it by the move, by how crowded it is or by size, and filter to the crowded end or to the assets that flipped side. What moved is more tradeable than what is.
- COT history. One currency or one pair in depth: its speculative position over time, week by week with the weeks it flipped side, a pair's two legs against their own years, or which currencies' positioning moves together. A pair is two positioning stories, and reading one without the other is how a crowded trade gets missed.
- Retail positioning. Every asset with the retail crowd's long and short split, how one-sided it is, where the futures speculators sit against it, and what a contrarian read implies. One is read with the trend, the other against it.
- Retail history. One pair or one currency in depth: a pair's crowd over time, one pair in full with where each side got in against the last close, or one currency across every pair it trades in. A crowd that has been long for three weeks is a different signal from one that flipped this morning.
Positioning, answered.
What is the Commitment of Traders report?
A weekly report from the US Commodity Futures Trading Commission showing how the major categories of trader are positioned in futures markets. The snapshot is taken on Tuesday and released on Friday afternoon, so the data you read on Friday is already three days old. That lag is a property of the release, not of any tool that displays it.
Is the COT report free?
Yes. The CFTC publishes the raw files at no charge and this page does not pretend otherwise. What takes the time is turning the file into a reading: the percentile against the market's own history, the change against last week, and the same picture across every market at once.
Why does percentile matter more than the net figure?
Because a net long of 80,000 contracts means nothing on its own. Against a market that has ranged between 20,000 and 90,000 over the last year it is close to an extreme; against one that has ranged to 300,000 it is unremarkable. The percentile is what makes the number comparable to itself.
Should positioning be read with the trend or against it?
It depends which positioning. Speculative futures positioning is read with the trend and matters most at extremes. Retail crowd positioning is read against it, which is why the composite score applies it contrarian at a weight of 10%. Reading both the same way is the commonest mistake in this area.
How many markets are covered?
44 markets across currencies, metals, energy and indices.
Is positioning on the free plan?
The four positioning panels (COT positioning, COT history, Retail positioning and Retail history) are Pro, at $49 a month or $490 a year. On the free plan positioning still reaches you: speculative positioning and the retail crowd are among the drivers behind the scores in Asset scores, which is free, and free accounts read three months of COT history where Pro reads all of it. The free plan carries 15 of the 49 panels across 2 boards, and every new account opens with 14 days of Pro, no card, so you can read the full positioning panels before deciding.